
Percona MeetUp for PMM Oct 27th, 2021
Percona Community Team orgnize Community MeetUp for Percona Monitoring and Management (PMM) every month to introduce some features that help optimizing performance, and improve the security of your open-source database environments. Here is the full video recording of the live-streamed Community MeetUp for PMM of last Oct 27th, 2021. Matt Yonkovit and Michael Coburn make a demo of the dashboard and some of the more incremental changes.
Video
Transcript
Matt Yonkovit:
Okay. That’s good, oh I stopped it. Welcome everybody. Hello Michael, how are you today?
Michael Coburn:
Hi Matt, thanks for inviting me.
Matt Yonkovit:
Hey this is the m&m show. So if you like m&m’s, vote for peanuts or chocolate m&ms or whatever new flavors they have. But the m&m show is live. Yes, rebranding this oh, it’s Carlos joining us today. I’m not sure. It’s Carlos. Carlos. Did you want to join?
Michael Coburn:
Let’s get him in here. Huh? Let’s get a man.
Matt Yonkovit:
Should I let her close in. We have a party crasher. Carlos. Carlos, are you joining us on our PMM meetup today? Maybe? Or maybe Carlos just wanted to tune in and click this to tune in. Hey, Carlos, are you joining? Oh, you’re only listening. Oh, well, Carlos, you join the waiting room. So now we have you on screen and your big CT. So he’s working on something. So we’re gonna go ahead and we’re gonna take you off screen, Carlos. But thanks for swinging by and watching. For those of you out in YouTube land or Twitch land. I am Matt Yonkovit. The HOSS and this is Michael Coburn. The not HOSS but the awesome, dude. So he is the second M and the m&m here. So we’re here to talk about all things PMM. Related, super exciting times. Lots going on. So we brought Michael back. Now, last time, we did a live stream, Michael. Last time, we tried to showcase a feature. And we had a user error.
Michael Coburn:
Yes, yes, we did. I’m glad you brought that up.
Matt Yonkovit:
I couldn’t go another second without bringing up the fact that we screwed up just a little bit. So if you didn’t watch the last stream, let me kind of set this up for you. Michael was showing us how to build your own custom metrics, add your own custom metrics into PMM. And so there’s actually a very straightforward, easy way to do it. You add a script and a SQL line into a file, and it’ll start collecting data, basically. That’s it, right?
Michael Coburn:
That’s exactly it. And the error that we discovered was that I had not named the database that we were pulling the table information from?
Matt Yonkovit:
Yes. So maybe, there will be? That’s okay. Because I did go back. And I did fix Michael’s stuff. So there is a blog, I’m gonna go ahead, and I’m gonna pull up the blog, just because why not? I did write a blog on this. And we can do another video drop. If people are interested in learning how to set up custom metrics using PMM. We would love to do that. But in case you are super curious, and judging by everyone who’s here, I’m guessing you are all super curious about this. Let me go ahead and share my screen. Oh, look at that, I can add background music to this. Whoa, that’s pretty crazy. So I’m going to go ahead and share the blog just so you guys can take a look. So if you haven’t seen this, and you want to get the conclusion to that exciting episode of the PMM meetup that we did live, on editing. See, that’s how you know it’s live, it was unedited, here’s how to go ahead and set up custom metrics. So this blog here is available on the Percona blog. I published this on October 14. But I will walk you through how to do that. And I do call out our mistakes. And so it is pretty cool. It does work, there is one thing that you should watch out for though, if the collection of that particular metric takes longer than the bucket, you put it in, and the bucket’s default to 5 - 10 or 60 seconds. If it takes longer than that bucket, it will start to cascade. So if you have one that takes a minute to put it in the five-minute bucket, you’re going to actually have 20 of those running simultaneously. And none of them will actually collect data. So that’s something that I did file a bug on. And I want to fix that because I think that’s a usability issue there. But anyway, that is the follow-up to that exciting, exciting episode. But we’re here today to not dwell on the past, but to talk about the future. Yes, the future. Michael’s here to bring us up to date on some cool and interesting things that are happening in the PMM world. Specifically, there are some new dashboards and if we have some time, we might get him to do a little bit on integrated alerting. So that could be really exciting. Right. So we’re very excited about that. And so, we’ve got a few folks out there saying hello. So hello, you know to folks out in YouTube land so Hi, Poorna, and hi, King and Harry are on. Well, and so it’s Gonzalo. So welcome, everybody who is hanging out with us today. Appreciate you hanging out, Michael. So Danielle says I need to shut up more. So if you don’t know Daniil, Daniil works in our community and I need to let my guests talk more.
Michael Coburn:
So fair enough. So, Michael, I can feel that emotion. Oh. Well, still respect.
Matt Yonkovit:
Yeah, I need to get some polls working on the live stream so I can have people vote and whether they want to hear me talk again.
Michael Coburn:
So well, from my side, I feel like I’m missing something with the hat on your hat today.
Matt Yonkovit:
It’s just the same. I wear this hat all the time.
Michael Coburn:
That’s exactly it. This is an important stream. I thought we might see an elephant or something. Oh, The HOSS is back. He made my day
Matt Yonkovit:
I only wear the elephant for Postgres. I don’t have a pee. Mm-hmm. We need a PMM like a hat. So anyway, Michael, would you like to share your screen and show us something technical,
Michael Coburn:
I would love to do that. Now, I’m a bit of a newbie to the restream business here as well to this app. So I’m going to do my best flipping us over between windows here. I think I click the share screen, and I can choose the Chrome tab. Let’s do the whole window there. Okay, I think I got this.
Matt Yonkovit:
Okay. Now, it asks me to send this up. So there you go. So it’s a little tiny on my screen, and it might be tiny for other folks. So you might want to actually zoom in a bit there. But I think that I might be able to make this a little bigger if we play around with some of these settings. So I think that is probably the best I can do. Always a little hard in the old restream there. But there you go. I think it’s reasonable enough for what we’re looking at.
Michael Coburn:
Okay. Okay. Well, let’s start us off. Hi, I’m Michael. I was a past Product Manager for PMM. And I’m on the consulting team here at Percona. And I still love using the product PMM. Because it helps make me more productive when I’m working with our customers. I’ve looked at a lot of our competitors out there as well. And there are some great products. But what I love about PMM is that it’s free and open-source free as in beer, you have access to the code. And it works really, really, really well against the major open source databases. So today, I’m going to be talking about only my SQL technologies, but it also applies to Postgres and to MongoDB. So I’m going to start us off with just a little bit of background on what I’m working on right now. We have releases pretty much every month for PMM. And what we like to do is introduce some new functionality every once in a while, along with any bug fixes, and then huge new departures of whole new ecosystems of changes. So I’m going to try to touch on all three of those different components. Today, I’m going to start on some of the more basic, the more incremental changes that we’re trying to do, and dashboards are one of them. And so I’ve got the node screen up right now if you’ve used PMM. Before you’re probably familiar with it, the point of this scream is to give you the operating system or the hardware level view of activity. So it’s going to give you the CPU, RAM disk memory, those types of things. So what I’ve got here, I’ve got a three-node cluster, I’ve called them Percona community primary replicas one and two. And we can see that they’re doing some work, our primary is doing a little bit more CPU than the other two nodes, right now, as you can guess, I’ve probably got some workload running. I’m using sysbench. So the metrics don’t necessarily flare up and down all that much. But the point is, I’ve got some activity happening in the cluster. Now, where I want to go with this is you’re used to looking at maybe a view of all of your disparate systems together, which is often helpful if you have maybe a handful or maybe 10, or 15. But for some of the customers I’ve worked with recently, they might be in the several hundred, 500, 700 different instances. And at that point,
Matt Yonkovit:
That would be a very busy graph.
Michael Coburn:
Well, it would, you’re absolutely right. Now, the interesting thing about many of these graphs here on this screen is only dedicated to the top five. So they will look at out of those 500 servers and do the arithmetic to calculate which are the busiest and plot those on our screen. But in some of the earlier sections, you would get an appropriate node count here of say, 600, or some grand number. So it’s a really useful dashboard. But the challenge for me is that if I’m looking at several 100, there’s not a lot for me to drill down on. So what have we done, we’ve got the premise or the concept of environments. These are some labels that you can attach to your instances when you’re defining them in PMM. And then, once you have labels assigned properly, you can then use those in these drop-down menus. So what I’ve got right here, I’ve got this environment Overview Dashboard. You’re going to see this in an upcoming release. It’s not yet slated for a specific version. We just did a release for 22.0. But I like this one because it gives me a handle over how many environments I might have already defined. So this is going to tell me I’ve got two total environments to find out of three servers, I couldn’t go too crazy with that. And some overall metrics of it. So it’s kind of a replacement of the nodes dashboard that we were just looking at, but presented a little bit differently, a little bit more awareness of the environment.
Matt Yonkovit:
And so to clarify, that those could be production and development, those could be individual applications. Because you might have multiple nodes or multiple things running, correct.
Michael Coburn:
That’s exactly right. They’re free string fields, you can type whatever you want in there. Okay. So that’s a good point, I should have highlighted this sooner. I defined it as a production environment and an analytics environment.
Matt Yonkovit:
And that can consist of as many nodes or as many, like disparate databases as you want. They don’t all have to be just MySQL, you can have Postgres and MySQL and Mongo all are part of one environment, correct?
Unknown Speaker
That’s exactly right. That’s a great use case. Right there. Yeah.
Matt Yonkovit:
So, that helps you really with the monitoring of not only the production workload, which everybody generally cares about. But I think one of the most under-monitored is often the test environment because if you can catch those issues and test before they move to production, you’re going to be like, 10 times. Better Off.
Michael Coburn:
Completely agree with you there. Yep.
Matt Yonkovit:
Yep. And hairy. Yes. So environments are kind of like groups. Yes, it’s in layman’s terms, it is groups of servers and groups of services that are being collected.
Michael Coburn:
Now, we can get a little fancy, when we scroll down here, some of my customers have talked about the fact that they’re in a cloud environment, and they want to understand utilization. And so this, these types of views, when you get the CPU, or the memory usage per environment, they can then make assessments based on their spend. So if I were to say that this is what my production environment looks like, and I’m only using under 25%, there’s probably an opportunity to at least begin a conversation with my SRE and my developers to say, are we over-provisioned? So it’s kind of nice that you can now compare and contrast resource utilization across different environments, or different groups, as Harry mentioned. And then down at the bottom, a nice little helpful drop-down box. So you can get a list of which instances are involved in those environments. And I think one little small bug fix is that I’d like to see maybe the PMM server defined with an environment that would at least help us categorize it somewhere.
Matt Yonkovit:
Or if you like the services, I guess you could just for this, you could just eliminate any that don’t have an environment. So honestly, let’s go off-script here. And let’s edit those services really quick. Let’s show people how they can edit that out if they don’t want to see that particular item. So you have that list? And PMM, obviously if you might want to monitor that server, you might not
Michael Coburn:
you’re going to have to probably help me on this here. How are we going to say it has to be really put me on the spot?
Matt Yonkovit:
Yeah, put you on the spot here. So um so you’ve got the environment there. So you’ve got the node name equals and the service type equals that. What’s interesting is that the environment drop-down variable didn’t have a no, did it? Or did it have it? No, it doesn’t. It doesn’t. So it has it all? So I mean, it’s basically just like, if you picked analytics and production that should eliminate that, like, just do that real quick. So analytics know up at the top. Yeah, just choose analytics and production. Yeah, see, it disappears. So you can get rid of it that way. But in this particular query, you’re going to have to do the environment. Not equal to no, I think are not equal to just empty space. I think that will work. Do you want to try it? Yeah. Yeah. Do you want to try and see who wants to try? Like I like to fail live because that way other people don’t have to fail live.
Michael Coburn:
See, does that throw an error? Oh,
Michael Coburn
Matt Yonkovit:
Yeah, throws an error. Yeah, it doesn’t like that on parse data. Yeah, let’s try removing just this section because I may not like to see jobs. Yeah, jobs are just the dot star. I wonder if you could do the dot just like that. No, that start is gonna be everything. Yeah. Yeah, he’s got already so Yeah, I mean that that stuff is gonna be everything. So it’s got to be like, is it just the environment? So is that not the issue?
Michael Coburn:
Well, it’s either we don’t want to exclude the Node or we want it as long as it’s defined.
Matt Yonkovit:
Yeah. Yeah. I put Michael on the spot. I like to put him on the spot and challenge him. so we’re gonna pull up the Prometheus cheat sheet here.
Michael Coburn:
I think we’re gonna need to
Matt Yonkovit:
Let’s see what’s not equal in Prometheus? Look at are you looking? Are you looking good as well? Yeah. So I have to turn around. Yeah, it’s just not equal. Yeah. So it’s undefined there.
Michael Coburn:
I think we might be colliding, so let’s remove this.
Matt Yonkovit:
Yeah, but the only problem is that then that will enable your dropdown.
Michael Coburn:
True.
Matt Yonkovit:
So while I look for that, you can go back to your other thing and continue on, I will find that while we talk, so you want and then we’ll come back to that one, and I’ll find the operator for that in particular, okay, that’s an unusual one, I’ve never had to like eliminate one that is a no value before. I’ve had it where I’ve selected the list. And certainly, you could select the list and that list of analytics and production. But then if you add something else, then you would have to go in and physically add that to the list. Right, which you don’t necessarily want to do.
Michael Coburn:
And I’m thinking that if this gets deployed on default instances, and people haven’t declared variables, right for the environment, then they end up with a lot less nodes showing up on this dashboard. Yep, maybe a better use case to have it still accept nodes, but maybe an egg screen on there saying it looks better if you define this. Well, let me take you into another view of it. So the overview is designed to give you a nice high level, to compare your environments against themselves. When you go into the environment summary. It’s essentially the same data, but it lets you drill in on one environment at a time. And again, imagine with me, this is a little richer if you have more than two nodes. But I think we have something we can work with here. The difference here is that the environment summary like we were showing before, is this one pins you two, you have to basically declare it, there’s no all option anymore. So in my case, I picked the production one that has two different servers based on it. And it lets me now compare the servers against each other. This is somewhat similar to what you’d get on the node screen as well if you highlighted just your two selected nodes. But this one here, we can do it by using an environment label, rather than a nodes overview, you have to do it by finding the node name itself. So I find this one a little more useful. I like how it’s got a kind of different left and right display to it. But again, you can notice that we’re doing the CPU memory and disk comparisons against each other as well. A little different down at the bottom is the table that we were showing earlier, which really just listed names and environment labels. Here, it’s a little richer. This view reminds me more of the default dashboard when you open up PMM, where it shows you high-level metrics of each of the hosts or nodes connected to your PMM server. So this is just showing us how many users are connected to my database, what the queries per second are, etc. I think that’s kind of neat. The difference here though, is you don’t get a click button as you do from the home dashboard to jump to the graph. This view here on the environment summary is designed to be a static read-only view of metrics. I think it’s kind of neat.
Now I’m switching gears a little bit because I’m a MySQL guy first. I had done a little bit of work a few months ago, and it hasn’t yet made it into the product, maybe I need to push a little bit harder. But I want to show you guys a little bit of what you can do by extending the dashboards to develop scratch a niche. Basically, I had a customer come to me and say, Michael, I’m really interested in semi sync replication from MySQL. And I said, Well, I’m game. I’ve never really used it before, but let’s give it a shot. And so would encourage me to spend some time looking at what metrics are available, what is exposed by the server, or what they’re being collected by the exporter. And lo and behold, I was pleasantly surprised that we were collecting this data. It was already available. It’s in everybody’s PMM instance right now if you do turn on semi sync It just wasn’t able to be displayed. So my job was greatly simplified, it really became, understanding those variables, what do they mean, and then relating them on a dashboard. And this is admittedly my first blush at it, I found some errors already when I zoom in tight on some, some axes, numbers, and things like that. But the point is, I want to talk to you guys a little bit about what you can do with this dashboard if you happen to use semi-sync. So let’s take a quick step back: what is semi-sync? In traditional MySQL, asynchronous replication, which has been available for over 20 years, basically means that there are events that happen on a primary, and we want them to reoccur on a replica. And there were different methods over the years of how those events got carried down. Suffice it to say is that there’s this log that gets written, the log gets copied, and the log gets re-executed and applied on the replica. It’s a beautiful system, and it works great. And it’s probably one of the killer features of MySQL. Well, one of the things that we wanted to be cognizant of in the MySQL community was we wanted to be sure that at least one or some of our replicas had actually acknowledged or actually receive the event before we were committed to the primary. And the reason for that is we want to achieve high availability, we want to basically say that any data change that hits your primary account also exists on another server. So Should your primary fail and go offline, for whatever reason become unavailable, unrecoverable, we at least have a record of that change elsewhere? Sure, you’re going to take some downtime, we’re going to have to reposition replicas and do some my school asynchronous repair work. But at least you’re sure that if you acknowledged a commit, that you wrote some data to your database cluster to your application, your application thought it was written, you can say yes, I have that thing somewhere, and I can recover from it. That’s basically in a nutshell, the point of semi-sync replication. Now in the weeds, what it’s actually doing is saying, I have this event happening on the primary or right event, I’m going to insert some records or update a record. And right as the server is ready to say, Okay, I’ve got everything done, I’m going to acknowledge a commit back to the application, it says hold on, I need to send this event down to my replicas, I need to make sure that it’s written to at least one of them into their relay log doesn’t mean it’s been applied on the replica yet, but it means that it’s been actually committed to their relay, so it’s on disk somewhere else, once that event is acknowledged, is done, then the primary server could acknowledge the commit and release the connection back to the application server, and life goes on. So what does that mean, in practice, it has the potential to slow down just a little bit your right load, it means that there’s going to be additional latency introduced. Well, when I mentioned that to the customer, they were like, well, that’s a great feature. But how much of a latency metric? Is that actually going to be? What is my penalty going to be? And with this dashboard, I was able to answer them rather than hypothetical theoretical questions, it should be maybe this, it depends. I was able to actually show what the actual numbers are. So without further ado, let’s talk about what some of these components are.
Matt Yonkovit:
Like what we do have a question on the screen.
Michael Coburn:
Is it possible to integrate with ServiceNow? The ticketing system? Well, in fact, Percona just recently switched to using ServiceNow. So I’m a little more familiar with that product. There is the concept of doing webhooks from within PMM. That’s generally around our alerting components. You basically have an event that occurs at a threshold level and you want to go and tell somebody about it. The basics were to send an email, maybe send me a pager duty message. And now there’s maybe a logged ticket, which is assuming that we’d want to do a ServiceNow. We have implemented this, myself and a couple of other members of my team, we have implemented alerting from PMM into ServiceNow, specifically, so yes, absolutely can be done. I won’t be able to go through that on this demo call right now. But at a later date, we can go through.
Matt Yonkovit:
So maybe, maybe chalk that up for a future meetup, how to integrate with external ticketing systems. I think there are two things without an internal ticketing system, which I’m interested to know which one we’re talking about, would it be integrated alerting automatically opening up a ticket in ServiceNow? Or if it would be like a link to say, open up a ticket based on what I’m seeing right now. Right, I think those are two separate use cases. Right? One is automatic. This event happened. Therefore, based on this event, let’s go do this thing. Versus Whoa, this is weird. Somebody needs to look at this.
Michael Coburn:
Mm hm. And that’s, I think it’s more the latter is what our customer I was referring to uses it for, so that they can then notify their team of 30 DBAs. That looks like there’s a potential severity of one event going on, and not that it’s just blasted to their email, but also that there’s a line in the sand. The event was reported to the team, and then there’s expected RCA or follow up that has to happen for a root cause analysis of the event so that they’re forced To close out a ticket. So it’s a very valuable integration. If people run ticketing systems to track outages and things like that, it’s always worth your effort to tie your alerting platform into that so that it drives accountability. And also, one of the great benefits is as you’ve driven that accountability upfront, it’s more work. Because you have to sometimes look at problems from a new perspective. But it forces you to write details and how you fixed it. And so the subsequent time, it might be you that gets that ticket for the same problem or somebody else. Now at least there’s some written documentation over how you solved it in the past. So forcing people to to log their ticket events is a really key thing.
Michael Coburn:
Let me switch gears back to the semi sync side. With semi sync, you need to basically load two modules, one that runs on the primary, and it’s called the master module. And then on the replicas, it’s called the slave module, you just run these as insert plugin statements, or you do it through the config file. Either way, you get it running. And then you force the, on the replicas, you force the plugin to be it’s now it’s loaded, you need to turn on the plugin. So you say enable, once you’ve got it enabled, your line should go green like this, I’m going to set my time range a little bit wider. So you can see what it looked like before. I had these colors yellow before, I’m not sure why I’ve got a dark green now. But these should be yellow, indicating that they weren’t enabled up to this point. And so what’s cool about that is this, I have this, this, this bar chart here, as a client could be disabled. And I’ll explain why that can happen. It will flop between enabled and disabled states. And that’s very useful. If you’re doing root cause analysis, you’re going to be able to look at the timestamp between when those States changed, and include that in your summary of the event. So that’s why I just love graphs that you can build us you can tell a story to your team, whether it’s other technical people or to your management team, or what have you, and say this is the sequence of events, don’t just trust me, trust the graphs that I pulled, that are all time stamped, and can also tell the story that I’m explaining to you. Let’s put that back to the one hour here. Okay. And then we’ll just whip these other ones here. What else can you tell from semi sync? Well, there’s two main components to it. There’s how many transactions are actually being copied. And those are somewhat measured by these acknowledgments. And you care that commitment acknowledgments should be acknowledged and not acknowledged, knowledge means semi-sync is running. And replica events are being committed properly and being told back to the primary, everything is great. So green lines are good. Yellow means semi Sync has turned itself off. And we’re back to asynchronous regular replication. So you don’t necessarily know that the servers will automatically hit timeouts and flip back to not acknowledge state to or disabled semi sync. And you may be completely unaware of that until you check days or weeks or months later and find out that it’s been disabled for a while. So this graph will show you as it gets turned off, the green lines will stop and the yellow line will spike. What it will mean is probably your throughput will get better when you go back into the not acknowledged disabled state because there’s not the overhead anymore of having to acknowledge commits. Okay. So I wanted to have this graph. And I wanted to be able to show to people over a 30 day period if they needed to, to be able to go back in time and say, when did this thing fail. And that leads me to my next point about this kind of graph. That’s a classic kind of error, you’d want to have an alert driven on it, you’d want to know when not acknowledged is greater than zero. I’d want to wake up in the middle of the night probably, oh, go ahead.
Matt Yonkovit:
So for these graphs, these are ones you built, these weren’t built? Elsewhere, right?
Michael Coburn:
That’s right.
Matt Yonkovit:
So can you maybe show people the details on how to build those? And what, where you got the data? I think one of the things that you like when you talk about custom graphs, so there’s there’s two, there’s two things, right? So either you’re going to get some data out of the box, or you’re going to want to create stuff that’s a bit more rich for you. And if you want to create some things that are a bit more rich, how do you go about doing it?
Michael Coburn:
Good question. Good question. I just get carried away showing off all the fancy stuff
Matt Yonkovit:
should show up. But let’s teach people how to fish.
Michael Coburn:
Absolutely. Get your fishing rods, get your hats on, let’s get this going here. Okay, the first thing you need to do, you need to be logged in as an admin user. If you’ve just deployed it as I did, and you haven’t created any other users like I didn’t manage admin or the credentials and you are at an administrative level. Point mate, you’ll know because, at the top, you’ve got this little gearbox. So first, you’re going to click the gearbox. And the first thing you see is to make editable as the blue button. Click that. And then you can immediately just hit the Go Back button here. Okay, you’ll notice that there are a couple of other icons that popped up, it basically means I can add new stuff to this dashboard and save it if I want. Now I’m in an editable state. That’s important. Even if you really just want to browse your graph, at least I find it more useful to be able to now go into what’s called the edit menu here. Okay, I’m going to close this on the right, just collapse it so we can look at one thing at a time here. So what I’ve got is a classic default way of looking at metrics in PM, sorry, in Grafana, which is what PMM is based on is the graph, which is a time series using an X and a Y-axis. Generally, we’re plotting data over time, and we’re plotting one or more metrics along the Y-axis. In my case, I’ve got two different metrics series, which I’ve labeled acknowledge and not acknowledged. Now you’ll notice down here in the metrics box I like how it’s color-coded for us, it does this automatically. This form or this code here is what’s known as prom QL. Language, the Prometheus query language. And don’t be too intimidated by it, you can get by, let’s do a really basic one here.
Matt Yonkovit:
And by the way, can be intimidating because it is, it takes it for those who write SQL, it takes a little bit to wrap your head around it.
Michael Coburn:
Mm-hmm. I completely agree with that.
Matt Yonkovit:
We could do a whole session just on prom QL.
Michael Coburn:
But what I’m going to do is I’m going to basically disable these from being displayed. So now you’re in kind of a default, oh, I’ve just built my first little graph, and I want to put something on it. So I’m going to kick up an empty box here. This is what you’ll see out of the gates. And I’m just going to paste in the metric series. And let’s see if anything comes up. Okay, is that useful? To me? Maybe not so much. And why not commit acknowledgments? There are two types of integer values or float values, which I should say that you can use within Prometheus and Grafana. And I say they’re floats because they’re allowed to have decimal points. They’re not integers. So they can have lots of numbers after the dot. That’s an important characteristic. And number two, the two different types are, gauge or counter. And does anybody want to throw a stab at what those are? I’ll give you five seconds to put it into the chat. Okay, well, we’ll save you that.
Matt Yonkovit:
They want to look at the gauge or counter,
Michael Coburn:
gauge or counter? Well, let’s spoil a surprise. The difference is a gauge is a number that can go up or down. So a classic example of a gauge would be temperature, and the day the temperature can go up, and then it can come back down and then go back up and back down. Okay, the other kind is a counter. And that is something that generally starts at zero and only ever increments. And if you want to take a stab at this one, does anybody want to guess what we’re looking at on this screen here, I don’t see anything going down. So it’s probably a counter. And the counter with that is that matter, it really doesn’t matter too much when you’re collecting the data. But it matters when you’re using formulas against them. So you wouldn’t want to use a formula to calculate the rate of a temperature. That’s not a thing that makes sense, you don’t do that, you might calculate the average over a set period of time, but you would never really calculate the rate of, you could kind of calculate the rate of change, but you’d use a different formula for it. So I’m making a very long-winded example. The case here to say, if you just plot something straight up, it might not be initially useful, you’re getting you to need to put some sort of formula around it. So let’s improve this one. I know it’s a counter. So, therefore, I know I can use the rate function on it. Rate, if I just close this ought to break on me, should I throw an error? No, it did work. Because okay, because there’s a default interval that it’s using. And so what I’ve got here is it’s calculating a very, let’s see if I can even figure out what that rate is, can I change it with this? I don’t think it’s gonna be material. Yeah. So what you sometimes want to do with the rate is you want to find over what fixed period of rolling window time you want the values to be calculated for the rate event. So sometimes you might want to have more jagged lines like this, or sometimes, if I do, and this, again, is a notation for the for this is a notation for Prometheus. So it’s got its own special kind of syntax, five minutes, this is a very common way of using a rate. And what you’ve just noticed is it smoothed out my lines quite a bit, it’s really taken out the jagged edges, and kind of given me more of a trend, it depends on your use case, if I’m looking at something that is very, if I’m trying to analyze an outage for a customer, and I care about things that are changing second by second, I’m gonna want my rate of change to be very low, maybe a one second or a five-second. But in the case that I’m looking at a day’s worth of data, and I’m just looking to see if things are kind of looking healthy, I probably want a smoother line to educate me over that. So it’s going to depend on your context over what kind of value to put in here. In the case of Percona, we try to make it dynamic. So what we can do is we can actually use a variable that we’ve developed for the dashboards. Right now, I can have an interval variable that’s defined by this drop-down up here at the top. So now I’m looking at a one-hour view and I’m averaging over one hour so you’re going to get some pretty flat, pretty sloped lines. If I change this to one second, we should come back Yep, to pretty high, jagged values, and then somewhere in between, as I go down through the as I go up to the bigger numbers, it should get smoother and smoother. I think there’s and then it goes right to one hour. So if I set an I’ll set it to three hours, but it won’t smooth it all that much. Because I just don’t have enough data in here, I’d probably if I want to do things, average that rate over one hour, I probably want to have several hours of data for it to be a little more meaningful. Let’s put this back to the five minutes because it’s a nice way of looking at it. We just got a question. What would be a good baseline time interval for an interval or not acknowledgments, i.e. five minutes? That’s a good question. So you generally want to take care, you want to be careful with alerting so that you don’t get alerted on false positives. What’s the right phrase, a false positive or false negatives here, you want? Well, let me phrase it a different way. Sometimes events can flop between a failure state and then back to a healthy state on their own. So that means if it’s two in the morning, I don’t want to get woken up to be told that my server CPU is 100%. And when I get online, I’m all sleepy-eyed and blurry. And I look at the screen and I realize, yeah, it hit 100%, but only for two seconds. And then otherwise, it went back down to zero. That’s not a great situation to have been in. But the problem is already cleared. So why do I want to be awake and doing anything about it? So we introduced the concept of actually wanting a failure case to exist for a longer period of time. And in the alerts that if we have time that I can get to, we generally use a five-minute average, we want to see that the threshold has been surpassed for a five-minute window, you could argue that it could be one minute or maybe some different value. But the point is, you definitely want it more than just a couple of seconds at a time. So I generally say five minutes.
And then the second question from Harry, I see, is it normal for hiccups for one minute and then return to normal expected behavior? Well, is it normal, I don’t know, depends on the environment that you’re in, I expect a lot out of my cloud providers. And when I see them fail, given the amount of money that we’re paying them, I’d probably raise a ticket with them and say, Hey, I didn’t like seeing that they will hiccup for a few seconds there. But this is the real world. There is real hardware at the base of all of these. It’s not the cloud, it’s just somebody else’s servers that you’re running in. So they have problems too. So yes, there will eventually be blips or hiccups as much as AWS and DigitalOcean. And all the other providers put their energy into this, there’s going to be times when things do fail. So you can’t expect things to be 100% they’re going to be 99 with a bunch of nines success rate. Call me on any of this. Matt, if it sounds like I’m missing the point.
Matt Yonkovit:
It sounds reasonable to me. Although I had one of these. I just had a family fail. My daughter’s telling me that. Aren’t you going to take me to work at noon?
Michael Coburn:
Well, well,
Matt Yonkovit:
Anyway, continue on Miko, sure I will disappear. You might know why.
Michael Coburn:
Okay, I gotcha. I gotcha. So I just want to wrap up here on the last little bit at the top, oops, oops, oops, oops, sorry about that. So we’ve calculated a nice rate, we’ve applied a formula to our metric series. But where did I get that metric series from in the first place, let me show you a little cheat a little life hack for you? Here, we have this hidden dashboard, which you can get to by clicking at the top of any dashboard, and it pops this view of search dashboards by name. We don’t have this dashboard on any drop-down menu, but you can find it by text search. So if you just put in advanced, you’ll be able to see that there’s only one matching record, you’ll click it. I’m already on the dashboard. Excuse me. And now you’re looking at this kind of cryptic thing. Well, this dashboard is designed for investigation, it’s not here to do really anything other, you’re not going to share a link to this dashboard to somebody to be like, Hey, look at this cool graph, you’re gonna say, What the heck is in my database. Now, the metric field is where you’re going to do your magic. Now, let me just go back because I forgot what it’s called. Okay, so it uses a string semi sync, what I’m going to do is just totally cheat and say, Do I have anything in my database of metrics, X, Y, and Z, that include the string semi sync. And this is exactly what I did. I went to this dashboard, and I had semi sync enabled for this client, and I went, Wow, my job just got way easier. All I need to do is build some dashboards, I have all of these different metrics. And I’m already looking at these going well, there’s a few here that I haven’t actually plotted. I don’t have the number of master clients displayed. There was another one where I saw some trace-level stuff. I’m not sure about what all of these actually would be. So I could probably still be enhancing this dashboard. But let’s not make it too complex. Let’s stick with something.
Matt Yonkovit:
But what if this is where if you needed to get things that aren’t in here, you would go to that blog we highlighted at the beginning and add those With the queries that are custom queries,
Michael Coburn:
That’s a good point. Yep, you’d still come back to Advanced Data Exploration, you’d put in the string of the name of the metric series you just created, and it ought to appear in this list. So let’s choose one of these here. Oh, let’s choose one that actually has some numbers on it. We should call it a failure, man.
Matt Yonkovit:
I need my soundboard hooked up to this. So I could make some sounds.
Michael Coburn:
I found one. Okay, so what is this, this dashboard tells me another thing here. If we were meant, if you remember from earlier, we were talking about the difference between gauge and counter. So you can be able to tell what kind of value this actually is. Now we’re looking at an average wait time, that to me just out of the gate sounds more like a temperature than it does to accounting from zero up to infinity? So if but before, so that’s with me blocking out my view. Why do I think that is I think it’s a gauge? Well, this graph tends to highlight the difference. Now, the gauge value actually looks useful in some meaningful way. Whereas the rate of change counter is, I don’t know what I would do with that, that doesn’t look to me like it’s useful. So my point is, is that these dashboard events that are explanations can help you find the metric series in there. And also give you a hint, whether it’s a gauge or a counter Type value. Okay. So what I’m going to do back on this dashboard is I’m going to turn off the one that we just added and re-enable this little eyeball thing here to put the numbers back on. And now we’re back to where we were. Go back to the main dashboard. Set it back to one hour. Okay, why did the lines get flat, because I left my interval at five minutes on a one-hour range? If I put it back to auto performance, kind of clever, it can kind of figure out what the right inner value ought to be. And adjusted dynamically. If you want to get crazy with it, you can make your lines really jagged with one second, maybe that’s crazy. To lose your head, that was your head. Okay, so we’ll wrap up this quickly here. The other two pieces I wanted to highlight are the differences between these average wait times and the TX wait time, the average wait time gives me a handle on individual weights that are occurring. So I can say to the customer, they said, well, what’s the overhead cost of enabling semi sync? I would say to them at this moment in time, it’s 1.75 milliseconds. And it goes up to 1.7. What’s the peak over here? So it’s still under two milliseconds. So that’s basically two components here. One is the network round trip time between your hosts. And I’ve intentionally put these in two different data centers. I have one in LA, one in a wait a sec, that didn’t seem to make sense. No, these two are in the same data center. Now it makes sense. So their round trip time is less than a millisecond. So there’s the network round trip time. Plus, there’s time for it to do a write event to this relay log and commit it. So the answer is less than two milliseconds overhead. Now as your transactions get larger suspense are very small transactions, primary key rights. But if I had larger ones, either larger rows of data, like you’re storing JSON, or I don’t know, you just got Yeah, so if you’re storing very large rows, then your transaction wait time will probably go up a little bit. On average, one customer, this one customer, we were showing about a 12 millisecond overhead. Okay, so this bottom left one is pure gravy. The top right one is the total wait time that the server was waiting for. So it’s basically the number of transactions times the average wait time. So we’re somewhere in the 500 milliseconds per interval period. It’s spent waiting on the clients. So I think another way you could report that is, in a second, we introduced in this case, 353 milliseconds of new latency to the application. So they might be relevant to depending on who you’re talking to within your development or your management team over the benefit or the trade-off of implementing semi sync. Okay, I see there’s a question that just came in as an example for locking.
Matt Yonkovit:
I think the answer to this is pretty straightforward. I think there’s already pre pre pre-built lock and temporary objects under the MySQL dashboards. So to get an example for those, you can go in and pull up those default ones right.
Michael Coburn:
Let’s try let’s do some hot investigation here.
Matt Yonkovit:
Yeah, okay. Locking is in there.
Michael Coburn:
Let’s just do a quick search on it. Yeah,
Matt Yonkovit:
There are temporary objects. You just missed the temporary, yes, there’s the table locks. You can also get in ODB locks and enter the NDB dashboard. And the other one was temporary. example. Like usage.
Michael Coburn:
There we go. And yes, All right, so we do have some temporary tables being created.
Matt Yonkovit:
Yeah. So. So the answer to this question is, there are examples out there already. If you want to take those as a baseline, one of the best practices for creating a new dashboard is you can often just go into these dashboards. And if you click on the title, you can go into that particular graph or dashboard, right? And so you can edit it. And so you can make your changes to that prom QL and see how they did it. Right. So, Michael, go ahead and edit like that temporarily?
Michael Coburn:
Oh, into the actual graph there. Okay. So first of all, make the dashboard itself editable.
Matt Yonkovit:
Yeah, and then for this one, you can click Edit here. And as soon as you do that, now you’re in that prom QL. Again the Explorer view. And so here’s where you can add and make changes specifically to get locked in temporary usage. And like I said, there are examples already there. So if you want to pull those, I just copied them over. That works pretty well.
Michael Coburn:
Yep. Good point, Matt. One other thing I’ll add to that is, generally, it’s better that you also save this as a different name, choose the copy put a unique string, the risk is if you edit the system that will the dashboard that came with PMM. Next time you upgrade, your changes are just going to get wiped out. We don’t do any type of trying to merge your changes with anything new coming in. So that’s a risk, but create a copy. And you’re then you’re all good. Okay. All right. So that was the deep dive onto the MySQL semi sync, and also using advanced data exploration. The other component I wanted to talk about is integrated learning. I think we have time for that, don’t we, Matt?
Matt Yonkovit:
Well, I’m gonna actually switch over my phone. But you can take as much time as you want.
Michael Coburn:
All right. Hold on, let me do so.
Matt Yonkovit:
All right, and I’ll switch over to my phone, and I’ll be on stream off camera, but I will be
Michael Coburn:
Okay, trying to find it, it is down at the bottom. Okay. So Percona has the concept of features that we want to be used by people, and we call them generally available. And then there are features that we have in what is called Tech Preview. Tech Preview, as you can imagine, is an earlier view of this. And trust me, when I say this, it’s gonna be a little bit raw. But that’s okay. Don’t maybe use it in your prod environment or use it in your prod environment. But don’t be too don’t expect too much out of it, it’s still a kind of a first blush, it’s probably code that was kind of written the night before. And we’re hoping it runs well. Now, having said that, I don’t mean it to be fear. PMM is a read-only tool unless you use things like custom queries. But generally, 99% of PMM is a read-only tool. So many of these things that you turn on are not going to do bad things to your database. They’re not designed to take them down or introduce any new load. But the point is, is that on the other side, that could be a little raw. So how did I get here? I’m going to start on the home dashboard and show you how to enable what we call integrated alerting. And we’ll talk to you a little bit about where we’re going with it, and why it might be useful. So this is available in two to three. That’s what I’m running right now. You can see I’m on 2230, the dates are a little bit wrong, it just shipped on. I don’t know about the 23rd or something like that just a little while ago. Okay. You’ll go from any dashboard. On the left-hand side, there’s a configuration gearbox, and you want to go to the settings, and you need to be logged in as admin. To do this, you want to then click on Advanced Settings, and then scroll down a little bit. And you’ll see that our technical pre preview features are disabled by default. So we’re talking about integrated alerting here. So we’re going to turn this on, and then you’re going to apply changes. Actually, let me just take a step back, let’s turn it off. So I can show you the before and after. So on this alert here, I want to highlight this quickly. Integrated alerting is off. I’ve only got alert rules and notification channels. Don’t be distracted by these. These are Grafana alerting. That’s something else that’s a different beast. And we’re not going to be using Grafana alerting. Right now there are two, that’s what I want to highlight two options, we’re going to stay on the settings, we’re going to enable integrated alerting and apply. It’s going to really reload the dashboard. And now we’ve got a third option called integrated alerting. I’m going to go in there. out of the gates. It’s telling us at the top right, it’s in technical preview. So you can read about it. And it’s basically going to say this is a feature that might not be that clean yet and we’re constantly adding new improvements to it. But it does work. I’ve used it in some rudimentary ways to get some basic things collected out of your database system. So let’s look at that. There are four main tabs. And once you’ve got the environment set up, you’re going to spend most of your time on the Alerts tab, because that’s where you care. That’s why you spent the time setting it up. But out of the gates, there’s nothing to find. So let’s start at the far right, we’ve got notification channels. Let’s add one. Now, I did not actually configure this box for email. But if I would have had, like, I need to send mail or I need something to be able to relay mail off of this host. That’s something that we expect already to be defined. There’s a tool called SSMTP, which you can use. And if you can send mail using that, then your system will natively work. So I’m just going to put in my own email here. And we include instructions on how to define the email linkage on our documentation page. So I’m just going to kind of gloss over and say that your server where PMM is running has already been set up for email sending email to Michael. And this could be also something like an email to the distribution group. So maybe it’s your tier one. And then you define a separate set of email distribution lists or multiple emails separated by commas or carriage returns for different groups that need to be alerted at different times. And then I’m going to add just the second one, so I can highlight that. So this is an email to Michael’s boss. And I’m going to use the old Gmail hack. Because we’re hosted with Google. He just put a plus sign in you go, boss, and that email will come to me. And now I’ve got two different email tags here. I don’t need to do anything more.
What I want to look at are the alert rules. Oh, no, not defined yet. First, you need to have an alert rule defined before you can get an alert. So let’s go into the templates here. This is because PMMis designed for multiple technologies, we’ve already included some built-in that are available for Mongo, MySQL, and PostgreSQL. So what I’m going to do is I’m going to use the MySQL down to define, and then I’m going to stop one of the services so that we can see if we’re going to get paged on it. So first, we’re going to look at it. Oh, wait, I can open up the default ones. Okay, hold on here. Let’s add the alert rule. And then I think it’s going to show us what the syntax actually is. So the premise of using this platform, again, is still first blush, but it’s designed that you build up a template, and then you use the template to define an instance of the template. Okay, so I’m going to, like I said, MySQL down, let’s use that. I’m going to call it MySQL down by Michael. And I’m going to make the duration. Really? Well, five seconds is already pretty short. It’s a critical level warning, of course, I hope, and filters allow you to filter out by any variable that you’ve defined. So that’s kind of another reinforcing factor, that when we talked earlier about the value of defining your variables, so you could use things like the environment, dashboards, it also applies to how you can do integrated alerting, you can now filter based on that criteria. So for example, analytics, so I might want to have a filter just for the analytics environment. So I can then go to an environment, equals analytics. Okay, so now we will get a gist for the analytics environment. But I won’t do that, because I can’t remember which one of them I like. I like my demos just to work. So I’m gonna keep it simple. And it’s going to be a channel, what is the point of a channel and where am I going to send this? Well, MySQL goes down, it’s only me, I want to get told. But if I wanted to, I could also have a blast going out to my boss. So I’ll include that right now. And it’s giving us nowhere, this is what I was looking for is what is the expression that it’s going to use? I’m going to look at the variable, my SQL. And if it becomes zero, that means it is down. Let me know about it. That’s basically the premise of it. And what’s it going to say to me in my email, it’s going to say my school is down, and it’s going to tell me the name of the service. So in this case, it will either be Percona community replica one, or replica two. So I think I got everything in there. Let’s add it. Okay, it shows that it just created it. Yep, that’s an accurate timestamp for my local browser time. It’s almost 11 am for me. And now what I’m going to do is go back to my, to my text window, and I’m going to stop replica 02 and go sudo system control, stop MySQL. I’m just watching it go down. Okay, shows it stopped. Now what I’m going to do is I’m going to look at that first because it takes a little bit for the alert to actually get triggered. If I put it on that server, I should see it now and I’ll refresh this every five seconds. Put In the last five minutes. Okay, so now we’re starting to get these flatlines. They’re a bit of an artifact of, of Grafana. But there’s basically no metric series coming in for the server. I wonder if I could show a more conclusive way of showing that. Another way is we could look at the last five minutes from the operating system level for that host. And because I only stopped the service, you’re going to see that the host is still up. So the exporters are still running. But because my school D is down on replication, the CPU usage just dropped right off, because it’s not trying to replicate events anymore. Makes sense, right. So I can tell pretty conclusively that I’ve stopped MySQL on this host. Okay, so now while we’re waiting for our alert to fire here, I’m going to give it a little refresh here to see if I can get it to kick it up a bit. I noticed again, it’s a little bit raw. But I’ve noticed sometimes it takes a couple of minutes after I’ve created the alert to actually start either watching or collecting the data. And then after that, it seems to be fine. Honestly, I haven’t spent too much time digging into why that seems to be the case. But I’m going to leave this going for just a minute and take a look at some other graphs and see if I can. And then this should also show I’m on the replication summary dashboard. And now if I say the last five minutes because the server’s down, replication was lagged, and now there’s simply no values coming in. So clearly the server’s down. Actually, I don’t know why they stay green. That’s kind of a weird bug, too. It should show that they’re offline. Okay. Let’s hope that we can show it here. Oh, thank you. Thank you Harry for showing that I was still on the alert room screen. Yes, I was looking here. I don’t think this is an update to say that you have an alert because that’s not what the screen is for. It’d be on the alert screen over here. And there we go. Now we’ve got it. It Has been active since 1057 50. Oh, I didn’t get a timestamp. Oh, yes, I can get a timestamp. Let’s compare that. So it’s about a minute late. Maybe it’s only running checks every minute. And I just missed the cycle window of when it would run. But basically, my service is down. And I’m going to quickly check my email and see if I can show that in another window here. Oh, no, I don’t have the server set up for sending emails. So I bet in the segment, local send mail or postfix Q on the Ubuntu machine where I’m running it, I’d show that there’s a pending email waiting to be sent. So I wish I could show you the whole story. But basically, what we’ve shown today is I’ve defined a couple of notification channels, I’ve shown how to define an alert rule on basic criteria, and then trigger the alert by stopping the service. And now I can show that the alert is firing. I’m going to go back and start the service. Start and then let that happen and so that might take a minute or so for it to actually trigger and then clear the alert here. And while that’s going let me take a look at some of these questions here. Okay, I’m just gonna go back in time a little bit. Harry mentioned if you did an upgrade, and you made a copy of a dashboard, would it be visible after the upgrade? Yes, if you create a copy of the dashboard, and I’ll do that right now, just for argument’s sake. So I’m going to go into the dashboard settings. And instead of saving the dashboard on the existing name, I’m going to choose Save As. I’m going to call it something unique that equals a cool copy. I’m going to save it. Now when I go to browse for environments, I can spell it. And there’s an end in there, Aaron, now you can see that I’ve got two overview dashboards. I didn’t change this one at all. And now I’ve created a copy one. So these first two will get overwritten in the upgrade, this one will persist. Now another one from Tran Tran shows how to change the configuration to optimize performance based on graphs. I assume you mean my school performance. What configuration would you modify to optimize performance based on graphs? Well, it depends. I mean, let me assume unless you’re Tran Tran, you can mention a little bit more. Let me just make sure I’m willing to scroll to the top. Yeah, I don’t see anything coming in. So if I were looking at a server and I saw where I saw threads running sorry, threads connected, sorry, connections approaching Max connections, I might want to go back and modify my value of Max connections. So I don’t actually hit a hard limit. If I saw there’s another way to look at some data here. Here’s a good one. Michael Handler’s is a classic issue that many customers face and maybe aren’t always aware of; primary key lookups are faster than doing table scans. I think if you do any at my school, that’s probably a fair statement for anybody to agree to. Well, what this graph of the MySQL handlers will show you is that you have, you can display the difference between Read, read next, which is the green one, or read r&d. Next, what do those two values mean, read next means I’m reading the next record based on a primary or an index-based lookup, and read r&d. Next is I’m reading a record based on a full table scan, and there’s no index there. So we’re I’m trying to drive this for you. Tran Tran is that when I look at this graph, and I see a very high value for reading r&d Next, and in our case, basically zero for read. Next, we’re gonna go back to the customer and say, Look, we need to optimize those queries, you’re doing a full table scan, instead of index base lookups, you’re probably missing some indexes somewhere. So my configuration change isn’t to go to a config file and change some values, my, my changes to go to the, to the source to the SQL query, and say, What are you doing that so poor? What am I missing in my schema that can make the situation better?
Matt Yonkovit:
Yeah, Michael, I think that to answer that, it’s a broad question. Right. When you talk about changing configuration, and you talk about optimization, I think that there’s a whole session we can do just on that. If you didn’t see last month’s meetup, we actually went through a few performance-type graphs, from the OSS Summit. And so you want to check out that one as well. But I don’t see any other questions. And yes, I went, I dropped my daughter off, and I came back, all while we did live streaming.
Michael Coburn:
That is amazing. Amazing.
Matt Yonkovit:
Amazing. I’m sitting back at my desk already. Are there any other questions? I figured out that we can remove the PMM server from the environment. It’s not that hard. I’d like to see how to do that. If you go back to the variables, yeah, yeah. So go, yeah. You know that actually, the easiest way is to just do a node name. Not equal to PMM. Server. Right? So if you just add that after node name, like Node Name, node underscore name, then not equal to PMM
Michael Coburn:
Hold on, what if I put the service name into that? Server names might be different. I don’t know.
Matt Yonkovit:
Oh, consistency. However, what should work as I got to work on my other box here? Oh, if you have two queries, though, you’d have no idea. I do. You have to put them in both. That’s the issue. Because you’re joining those two, right? Probably the node name would have worked. But, yeah, there you go.
Michael Coburn:
Yeah, I look at that, Matt. Yeah.
Matt Yonkovit:
So that was probably why they not equal to null. Also didn’t work. You’d have to put it in both. Okay, so everybody, thank you for coming and being amazed that I can drive my daughter to work to bug a prom QL help Michael with a live stream and I still like popped questions and onto the screen while I was in the parking lot dropping her off. It’s amazing.
Michael Coburn:
It’s impressive. That’s only what the House can do. Yeah.
Matt Yonkovit:
But I don’t want to thank everybody for coming out today. next week. stay tuned for the next meetup. It should be MySQL next week. Follow me. Postgres might be delayed or postponed. I am not going to be in the office. So if someone else wants to host Feel free, we might find another host, or we might move it a day or two around for the Postgres one. But I loved having everybody here. Hopefully, this was beneficial for you all. And we will see you all next time. And don’t forget to subscribe and like because that helps us reach more people. All right, everybody. Thank you from the m&m boys. We are out!
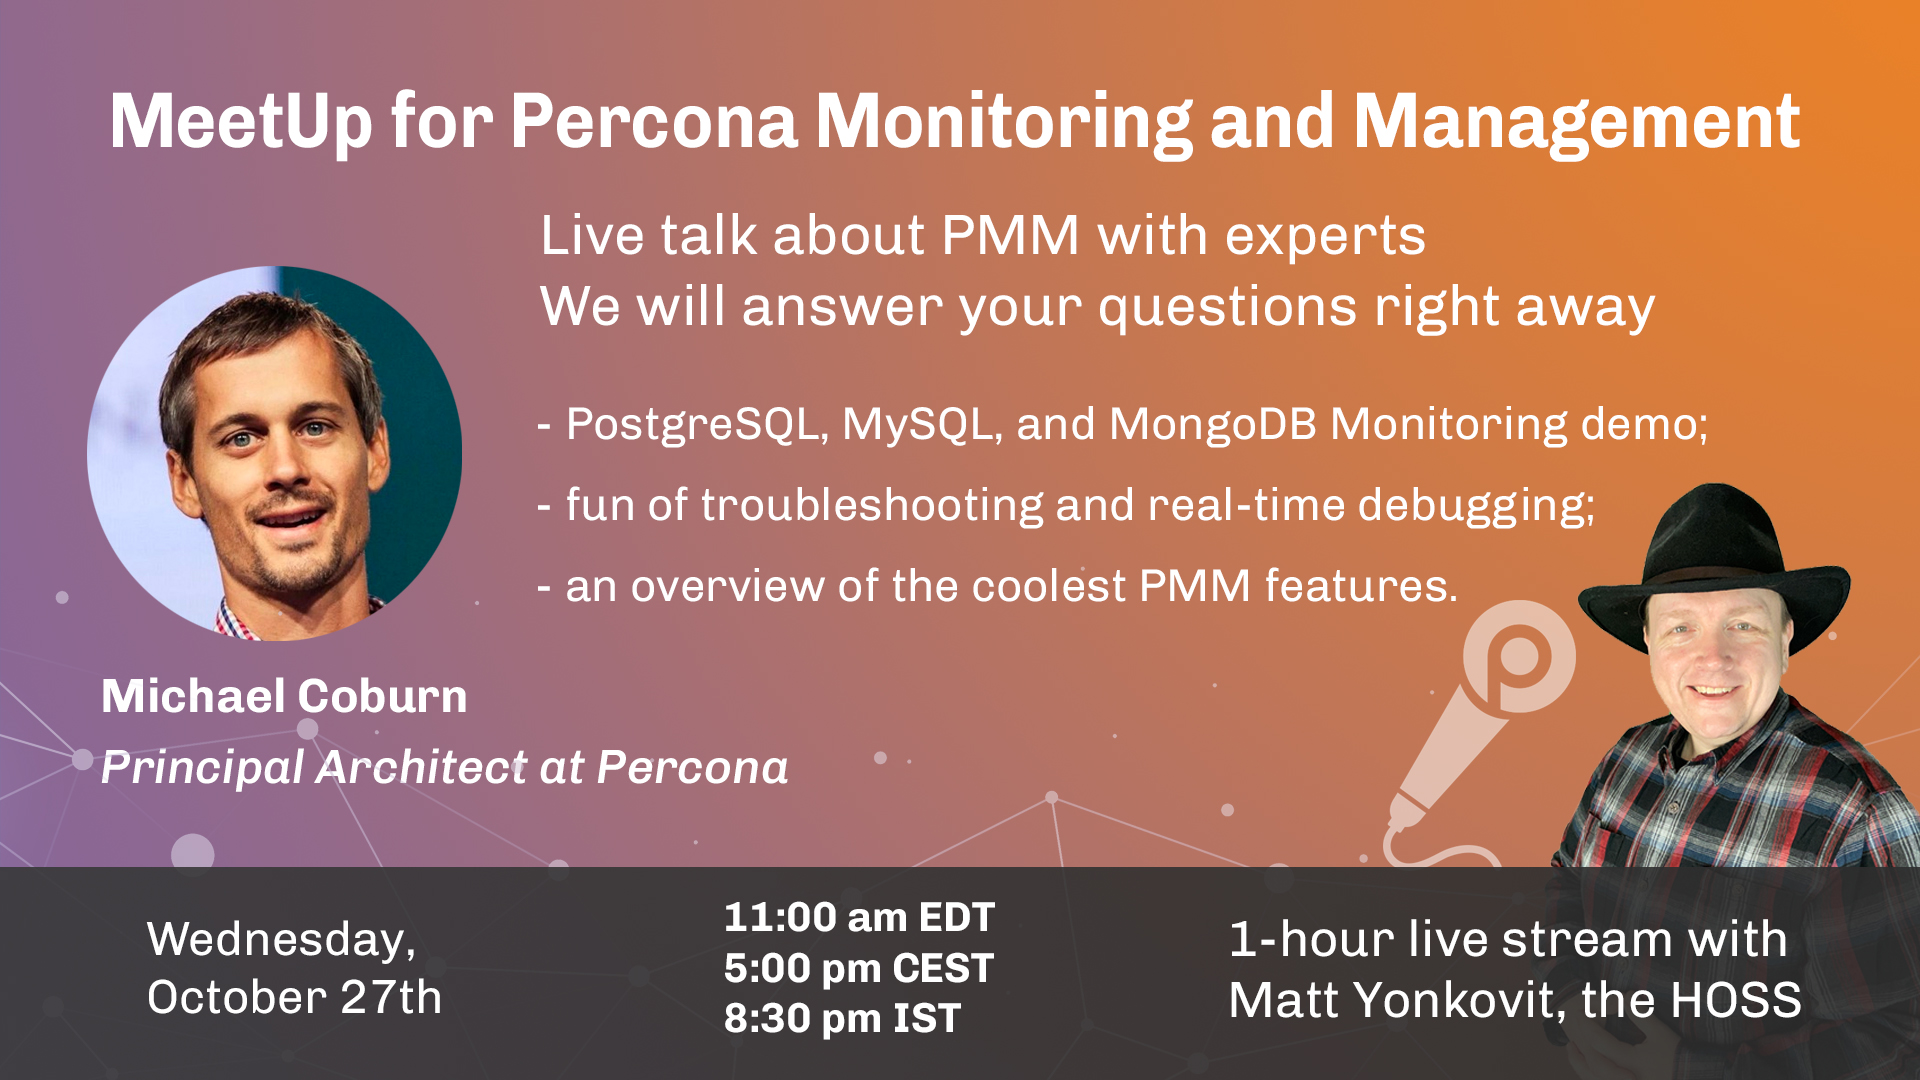
The Community MeetUp for Percona Monitoring and Management (PMM) is an 1-hour live stream to explain PMM features and functionality with a demo. Come up with your question and get an answer right away from our experts.
Join us for an hour MeetUp for PMM
Day: Wednesday, Oct 27th, 2021 at 11:00 am EST (5:00 pm CEST or 8:30 pm IST)
Add this event to your Google Calendar
Agenda
Live conversation and answers to your questions.
The MeetUp for Percona Monitoring and Management (PMM) highlights:
- an overview of cool PMM features;
- fun of troubleshooting and real-time debugging;
- a demo of Monitoring PostgreSQL, MySQL, and MongoDB
Attendance
- Your attendance at the MeetUp for PMM is highly encouraged if you are:
- Experiencing or working with business-critical database environments.
- Student or someone who wants to learn more about open source databases.
- Expert, Engineer, Developer.
- Interested in PMM.
Go ahead and come with your friends!
Subscribe to our channels to get informed of all upcoming MeetUps.
Invite your friends to this MeetUp by sharing this page. ∎