


PostgreSQL as a Workflow Engine: Building Reliable Long-Running AI Jobs Without Kafka
Chandan Shukla
 Community
Every document-processing system I have worked on arrives at the same shape. Something uploads a file, something else has to read it, run it through an extraction or inference step that takes seconds to minutes, and store a result. The work is slow, it fails sometimes, and the answer has to be auditable afterwards.
The default advice is to put a message broker in front of it. That advice is not wrong, but it is usually given before anyone has measured whether the database already sitting in the stack can do the job. So I built the thing and measured it: a job queue inside PostgreSQL, four different claim strategies, workers scaled from 1 to 16, a worker killed mid-job on purpose, and query plans checked against a queue table buried under half a million completed rows.
This is what came out of it, including the two places my own harness lied to me.
The workload I was modelling
Concretely: a jobs table that other services insert into, workers that pick jobs up and spend somewhere between 200 ms and a few minutes on each one, and a requirement that a crashed worker must not silently lose a job. Roughly the shape of an OCR or document-extraction pipeline.
Three properties matter more than throughput here:
- Jobs are long. If a job takes 200 ms, the coordination overhead is what dominates. If it takes 40 seconds, almost nothing about dequeue speed matters, and everything about crash behaviour does.
- Effects are external. Calling a model endpoint twice costs money and may produce two records downstream. “Roughly once” is not good enough.
- Operators need to see state. When something is stuck at 2 a.m., someone has to be able to ask what is stuck, since when, and what was the error — and get an answer.
That last point is the one that quietly favours a database. Queue depth in a broker is a metric. Queue depth in a table is a query, and so is “show me every job that has failed three times with a timeout in the last hour”.
Why I did not start with a Kafka broker
Not because brokers are complicated. Because adding one to this particular design buys capability I would not use, and costs state I would have to keep consistent in two places.
If job state lives in Kafka and job results live in PostgreSQL, then every transition has two homes, and the interesting failures are the ones where those two disagree. Keeping the queue in the same database as the results means a worker can mark a job complete and write its output in one transaction, and that pairing is either both true or neither.
That is the trade I wanted to test, not a claim that one tool beats the other.
The schema
The table carries the job, its lifecycle, and enough forensic detail to answer questions later.
CREATE TYPE job_status AS ENUM ('pending','running','succeeded','failed','dead');

CREATE TABLE jobs (
    id                bigint GENERATED ALWAYS AS IDENTITY PRIMARY KEY,
    job_type          text        NOT NULL,
    payload           jsonb       NOT NULL DEFAULT '{}'::jsonb,
    status            job_status  NOT NULL DEFAULT 'pending',
    priority          smallint    NOT NULL DEFAULT 100,
    attempt_count     smallint    NOT NULL DEFAULT 0,
    max_attempts      smallint    NOT NULL DEFAULT 5,
    created_at        timestamptz NOT NULL DEFAULT now(),
    available_at      timestamptz NOT NULL DEFAULT now(),
    started_at        timestamptz,
    completed_at      timestamptz,
    lease_owner       text,
    lease_expires_at  timestamptz,
    heartbeat_at      timestamptz,
    last_error        text,
    idempotency_key   text,
    result            jsonb,

    CONSTRAINT jobs_running_leased CHECK (
        status <> 'running'
        OR (lease_owner IS NOT NULL AND lease_expires_at IS NOT NULL)
    )
);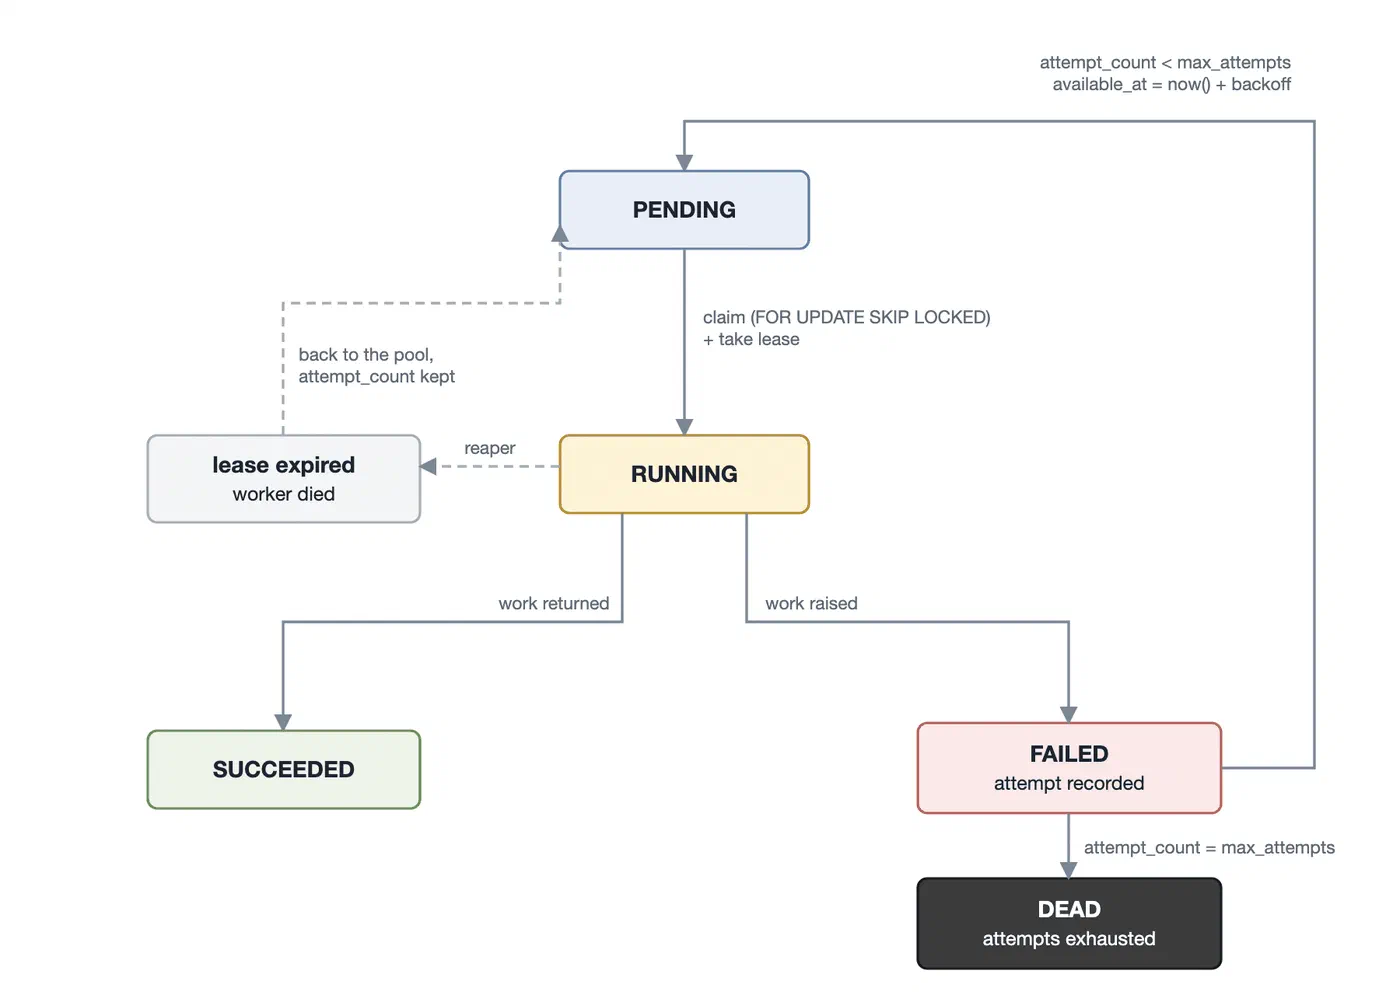
The five states and the transitions between them. A crashed worker does not create a new state — it leaves a RUNNING row whose lease stops being renewed.
Two decisions in there are worth defending.
available_at rather than a separate retry table. Backoff is just “not visible until later”, and a timestamp expresses that without another moving part. Every claim query carries available_at <= now(), and a retry is an update that pushes the timestamp forward.
The jobs_running_leased check constraint. A row that says running but carries no lease is unrecoverable by any automated process — you cannot tell a live job from an abandoned one. Making that state impossible to write means orphan detection is a predicate rather than a heuristic. It also caught two bugs in my own worker code during the lab, which is a reasonable argument for constraints that encode invariants rather than just types.
The naive version, and what it actually costs
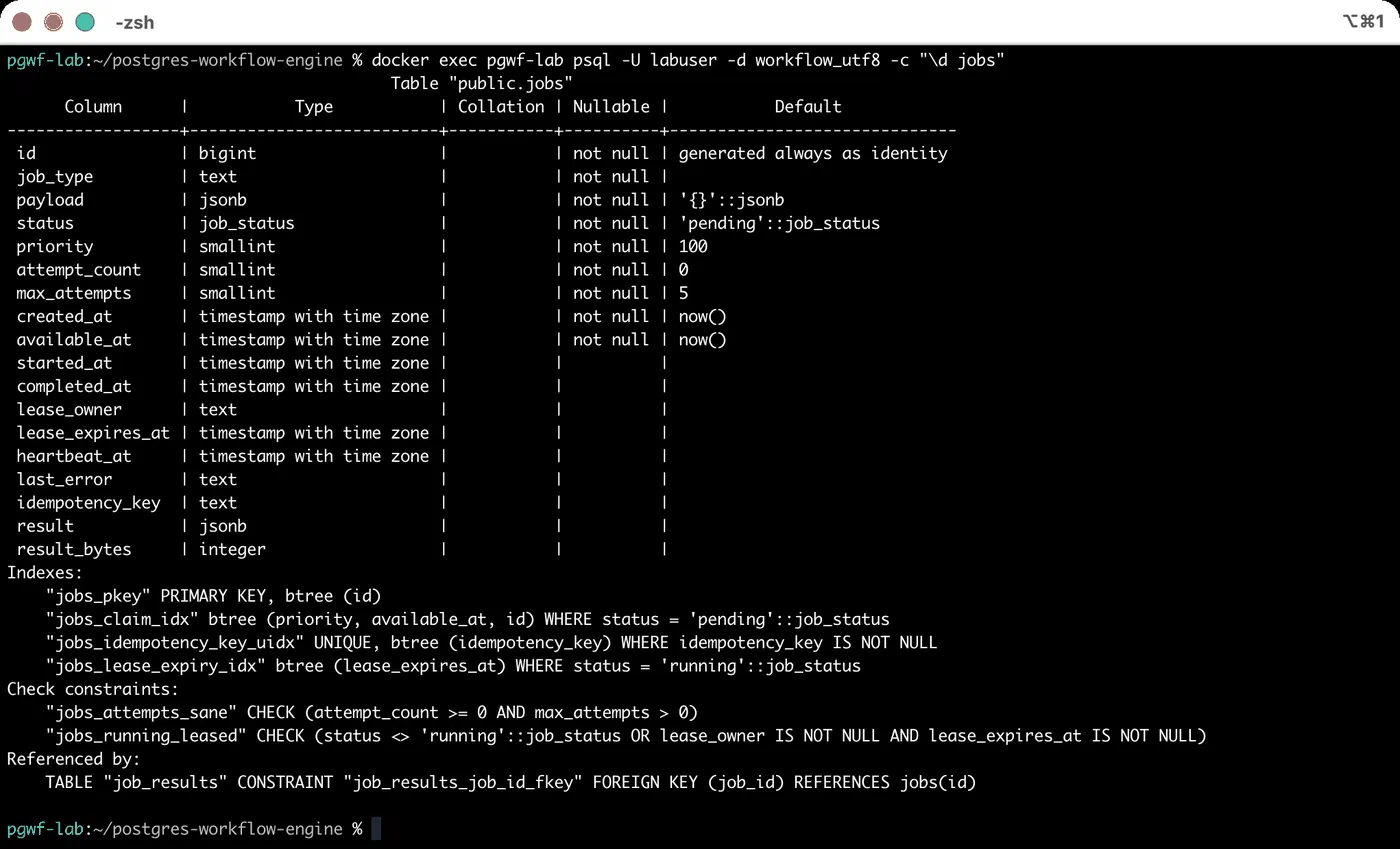
The table as PostgreSQL sees it, including the constraint that makes a lease-less RUNNING row impossible to write.
The obvious implementation reads a pending row and then updates it:
SELECT id, payload FROM jobs
 WHERE status = 'pending' AND available_at <= now()
 ORDER BY priority, available_at, id
 LIMIT 1;

UPDATE jobs SET status = 'running', lease_owner = $1,
       attempt_count = attempt_count + 1
 WHERE id = $2;
I expected this to produce occasional duplicates under concurrency. It is worse than occasional. At Read Committed, two workers running that SELECT as separate statements both see the same row, both update it, and both run the job. Nothing errors. No constraint fires. The queue drains correctly and every job reports success — several of them more than once.
400 jobs, 200 ms of simulated work each:
| Workers | Run time (s) | Jobs/s | Claims for 400 jobs | Jobs run 2+ times | Wasted runs |
|---|---|---|---|---|---|
| 1 | 84.38 | 4.74 | 400 | 0 | 0 |
| 2 | 73.28 | 5.46 | 695 | 295 | 295 |
| 4 | 41.65 | 9.60 | 787 | 233 | 387 |
| 8 | 26.08 | 15.34 | 979 | 286 | 579 |
| 16 | 17.34 | 23.07 | 1286 | 322 | 886 |
The second worker increased throughput by 15% while performing 74% more work. At 16 workers the pool did 1,286 job executions to complete 400 jobs, and still finished at a third of the rate the locking version managed.
Reading the claim log back shows how tight the window is. In a smaller run — 8 workers, 200 jobs — the same job was routinely handed out five or six times, and job 47 went to six different workers inside 2.2 ms.
Six workers, six full executions of the same document, inside 2.2 ms. When every worker is idle and polling — which is the normal state of a queue that has just been fed — they all run that SELECT at effectively the same instant and all get the same row. The race is not a rare interleaving; it is the default behaviour of an empty worker pool meeting a new job.
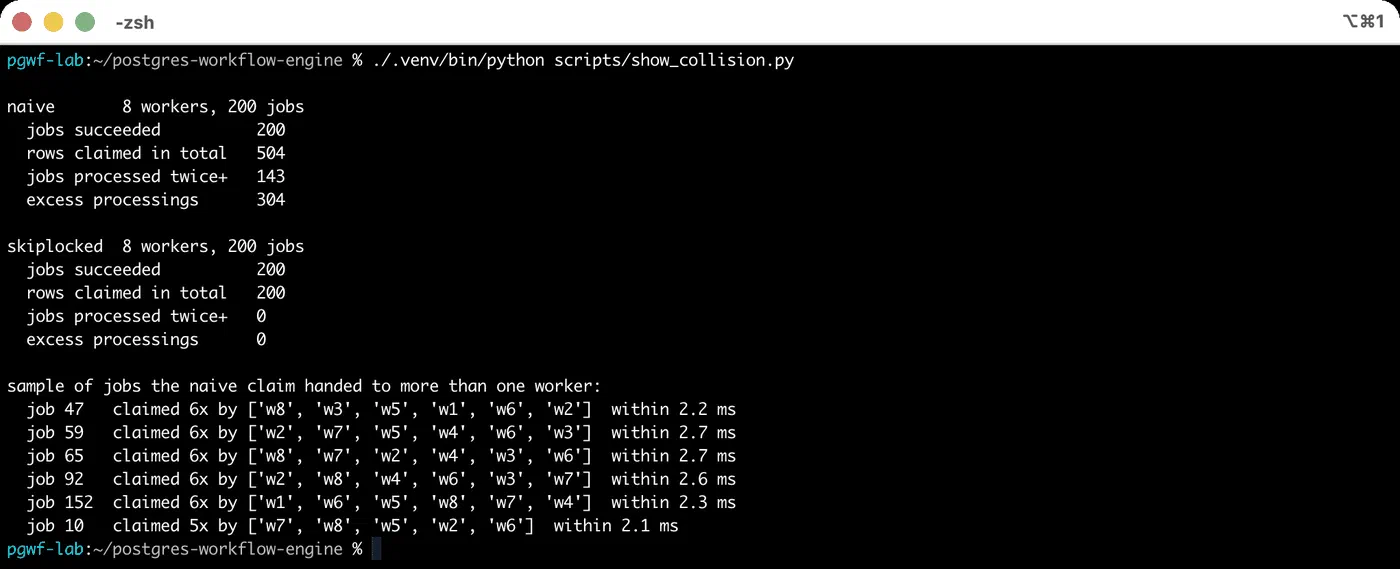
Both strategies against the same 200 jobs. The lower block is the same run reading the claim log back: individual jobs handed to six different workers inside 2.2 ms.
There is a quieter form of damage in the same table. The colliding UPDATE runs attempt_count = attempt_count + 1 once per collision, so the counter climbs without any failure having happened. I observed jobs sitting at attempt_count 3 and 4 on their first execution. Any retry limit reading that column is making decisions on corrupted state — a job could be buried as “failed too many times” having never once raised an error.
Claiming safely: one statement, one row
The fix is to make selection and marking a single atomic statement, and to tell PostgreSQL that a row already locked by someone else should be skipped rather than waited for:
UPDATE jobs
   SET status = 'running',
       started_at = now(),
       attempt_count = attempt_count + 1,
       lease_owner = $1,
       lease_expires_at = now() + $2::interval,
       heartbeat_at = now()
 WHERE id = (
     SELECT id FROM jobs
      WHERE status = 'pending' AND available_at <= now()
      ORDER BY priority, available_at, id
      FOR UPDATE SKIP LOCKED
      LIMIT 1
 )
RETURNING id, payload, attempt_count, max_attempts, idempotency_key;
SKIP LOCKED has been in PostgreSQL since 9.5 and is documented as row-level locking behaviour: rows that cannot be locked immediately are omitted from the result rather than blocking the transaction. For a queue that is exactly the semantic you want — a worker that finds the head of the queue busy should take the next row, not queue up behind it.
Same workload, same hardware:
| Workers | Run Time (s) | Throughput (Jobs/s) | Speed-up | Claims | Duplicate Jobs | Claim p50 (ms) | Claim p95 (ms) |
|---|---|---|---|---|---|---|---|
| 1 | 84.08 | 4.76 | 1.00× | 400 | 0 | 1.32 | 2.12 |
| 2 | 42.14 | 9.49 | 1.99× | 400 | 0 | 1.48 | 2.21 |
| 4 | 21.05 | 19.00 | 3.99× | 400 | 0 | 1.55 | 2.94 |
| 8 | 10.58 | 37.80 | 7.94× | 400 | 0 | 1.77 | 3.52 |
| 16 | 5.34 | 74.87 | 15.73× | 400 | 0 | 1.68 | 3.14 |
Exactly 400 claims for 400 jobs at every worker count, and scaling within 2% of linear to 16 workers.
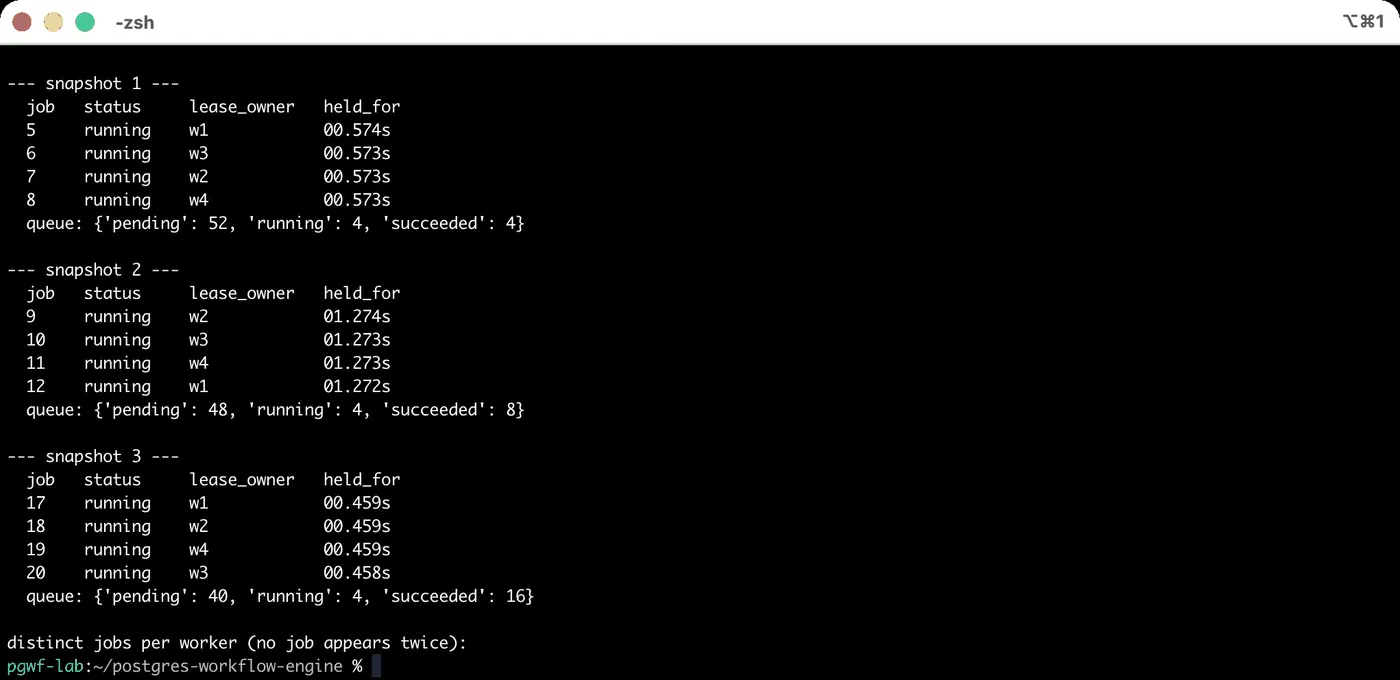
Four workers under SKIP LOCKED. Every running row has a different owner, and no job id appears twice across the whole run.
The number I keep coming back to is the claim latency. At 16 workers the median claim took 1.68 ms against 200 ms of work — under 1% overhead, and it barely moved as concurrency grew. Whatever eventually limits a design like this, the cost of asking PostgreSQL for the next job is not it.
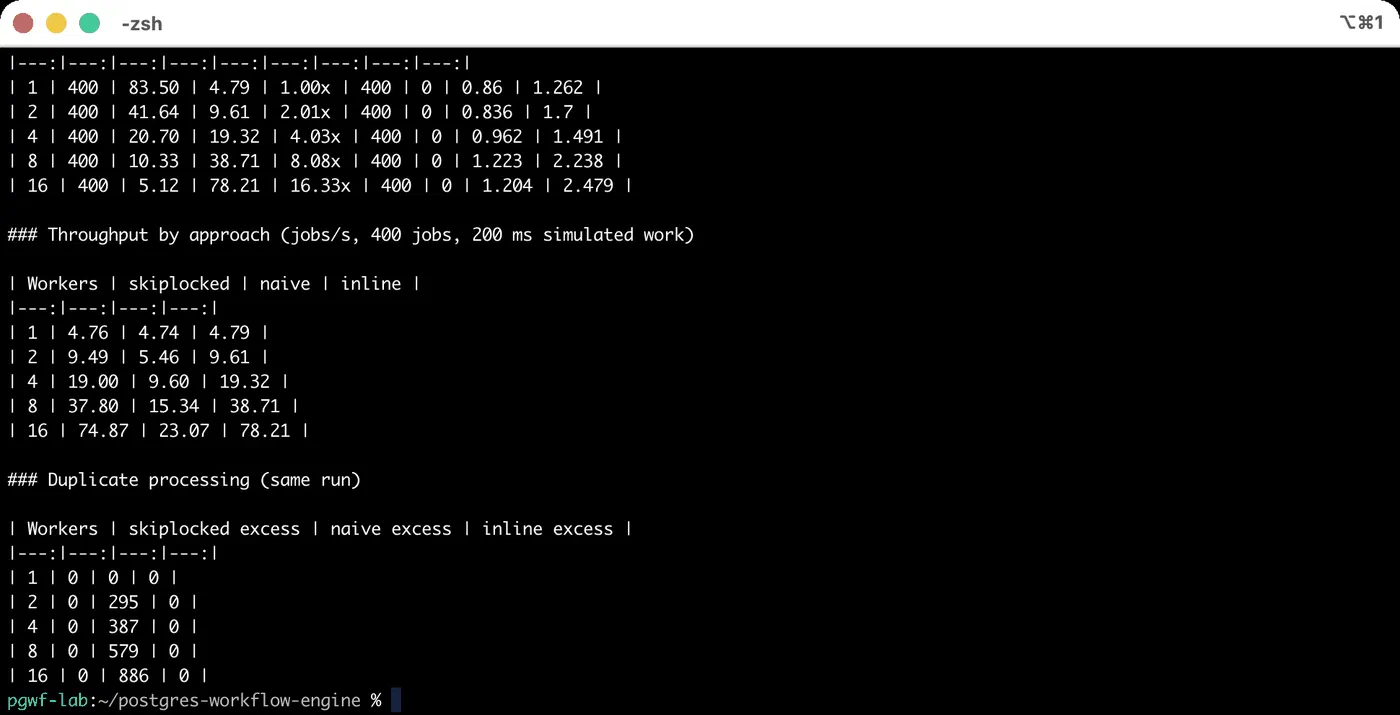
The tables above, generated directly from results/benchmark.csv rather than typed by hand.
The transaction-scope mistake, and what it actually costs
There is a version of this design that looks tidier and is wrong for reasons that took me a while to pin down. Instead of committing the claim and then working, you keep one transaction open across the whole thing:
with conn.transaction():
    job = claim_one_job()      # takes a row lock
    result = run_inference(job)   # 200 ms, or 40 seconds
    mark_succeeded(job, result)
It is appealing because it is atomic: if the worker dies, the transaction rolls back and the job is instantly available again. No lease, no reaper, no orphan states.
I expected this to be visibly slower under concurrency and built the benchmark to show that. It did not show that.
The throughput argument does not hold
| Workers | Claim + work outside (jobs/s) | Work inside the transaction (jobs/s) |
|---|---|---|
| 1 | 4.76 | 4.79 |
| 2 | 9.49 | 9.61 |
| 4 | 19.00 | 19.32 |
| 8 | 37.80 | 38.71 |
| 16 | 74.87 | 78.21 |
Holding the transaction open was consistently a shade faster — about 4% at 16 workers — and its claim latency was lower too (0.86 ms median at 1 worker against 1.32 ms), which makes sense: there is one round trip fewer, because the claim never has to commit on its own.
So if you argue against this pattern on throughput grounds, the measurement will not back you up. I had to go and find what the benchmark could not see.
What the benchmark could not see
I re-ran both designs with 8 workers while sampling pg_stat_activity, looking at connection state and at how far back the oldest snapshot each worker held was sitting.
| Job length | Approach | Connections idle in transaction | Longest open transaction (s) | Snapshot age (transactions) |
|---|---|---|---|---|
| 200 ms | claim, commit, then work | 0 | 0.00 | 0 |
| 200 ms | work inside the transaction | 8 | 0.20 | 10 |
| 3000 ms | claim, commit, then work | 0 | 0.00 | 0 |
| 3000 ms | work inside the transaction | 8 | 2.52 | 16 |
That is the actual cost, and it is not throughput. Every worker holds a connection in idle in transaction for as long as the job runs, and the open transaction pins the snapshot horizon for that whole time.
Notice how the numbers move with job length. At 200 ms the longest transaction was 0.2 s. At 3 s it was 2.52 s. The relationship is linear and unbounded, which is the problem: these were time.sleep calls, but the workload this models is a model endpoint that might take 30 or 60 seconds. At that point every worker is holding a transaction open for a minute at a time, and VACUUM cannot clean up any row version newer than the oldest of them.
There is a second cost that does not appear in either table. A connection sitting inside a transaction cannot be handed back to a pool. With a transaction-mode pooler in front of the database, this design pins one server connection per in-flight job for the entire duration of the job — so worker concurrency and database connection count become the same number, and you have given up the thing the pooler was for.
None of this hurts at 200 ms. All of it hurts at 60 seconds. The benchmark ran short jobs, so it measured the case where the mistake is invisible — which is exactly why the throughput table is not sufficient evidence on its own.
The shape that works
BEGIN
  claim one job, take a lease, mark it running
COMMIT

run the expensive work        -- no transaction open, heartbeat renewing the lease

BEGIN
  write the result, mark it succeeded
COMMIT
Two short transactions with a long gap between them. This is what the benchmark’s “skiplocked” numbers came from, and it is the version I would ship.
It does introduce a failure window that the single-transaction version does not have. If the worker dies during the gap, nothing rolls back: the row is left saying running, owned by a process that no longer exists. That is not a flaw in the pattern so much as the price of it, and it is what leases and idempotency exist to handle.
Indexing the queue: the history problem
A queue table has an awkward property. The rows you query are a small, roughly constant set — the backlog — while the table itself grows without limit as completed jobs accumulate. An index that covers the whole table gets steadily more expensive to maintain in order to serve a working set that never grows.
So the claim index is partial:
CREATE INDEX jobs_claim_idx
    ON jobs (priority, available_at, id)
    WHERE status = 'pending';
The column order matches the ORDER BY in the claim, so the scan can stop at the first qualifying row instead of sorting.
To check whether that predicate earns its place I ran EXPLAIN (ANALYZE, BUFFERS) on the claim against 500 pending jobs, then inserted 500,000 completed rows underneath them and ran it again.
On the 240 kB table the plan is an index scan over jobs_claim_idx: seven shared buffer hits, 0.032 ms. After inserting 500,000 completed rows the table is 91 MB, and the plan is the same index scan at four buffer hits and 0.021 ms.
The plan does not change and neither does the cost, because the index the claim touches only ever contains pending rows. History is invisible to it.
Dropping the partial index on that same table is the control. The planner falls back to a sequential scan with a sort on top, filters out all 500,000 completed rows to reach the 500 pending ones, and spends 10,216 buffer hits and 27.648 ms doing it.
27.6 ms and 10,216 buffers to find one job, versus 0.02 ms and four. With workers polling this query continuously, that difference is the whole design.
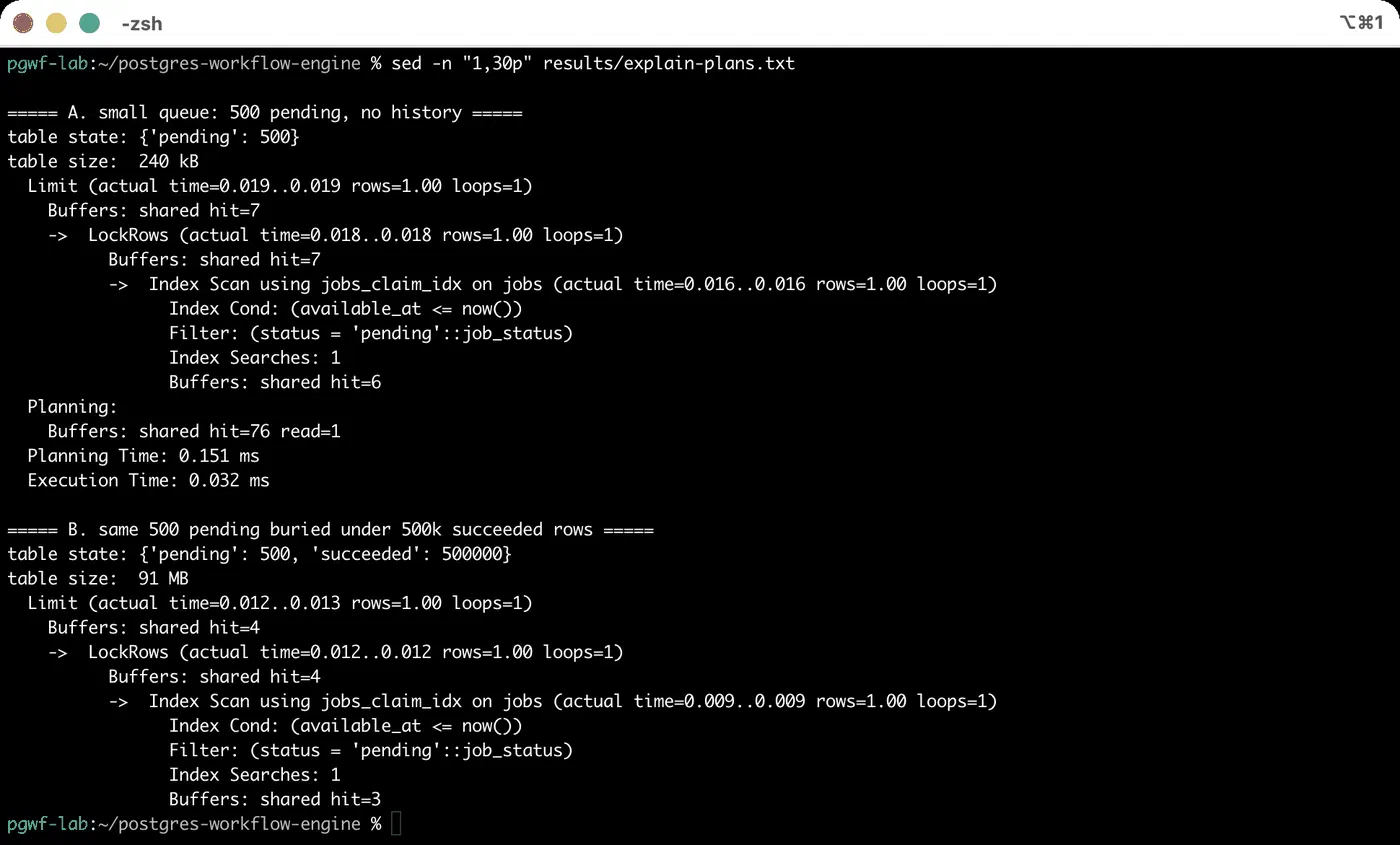
The same query in three conditions. The middle plan is the one that matters: adding half a million completed rows changed nothing.
The size comparison is the other half of the argument. On the 500,000-row table:
| Index | Size |
|---|---|
jobs_claim_idx — partial, WHERE status = 'pending' | 40 kB |
| the same index without the predicate | 19 MB |
jobs_lease_expiry_idx — partial, WHERE status = 'running' | 8 kB |
The partial index is roughly 475 times smaller and answers the same query, because it indexes the backlog rather than the archive. The lease-expiry index is smaller still: the number of running jobs is bounded by the number of workers, so it holds a handful of entries no matter how large the table gets.
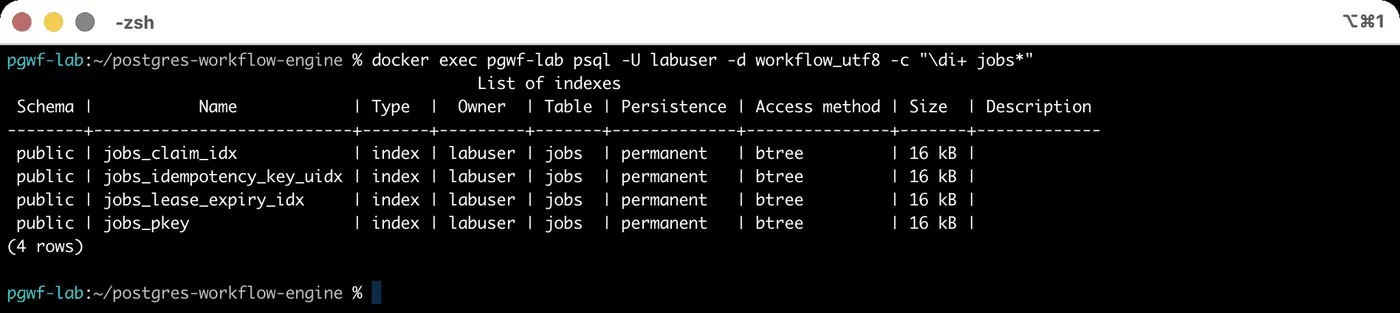
Index sizes on the queue table. The claim index is the smallest thing on it.
This is the one recommendation from the lab I would make without hedging. If you build a queue in PostgreSQL, make the claim index partial on the pending predicate.
What a crashed worker actually leaves behind
status = 'running' is not information. It is an assertion that some process was alive when it wrote the row, and nothing about the row tells you whether that is still true. A job that has been running for four minutes is either a slow job or a dead worker, and the table cannot distinguish them.
That is what the lease is for. Claiming a job writes an owner and an expiry:
lease_owner      = 'worker-7',
lease_expires_at = now() + interval '30 seconds'
and a background thread in the worker renews the expiry while the job runs:
UPDATE jobs
   SET heartbeat_at = now(),
       lease_expires_at = now() + $1::interval
 WHERE id = $2 AND lease_owner = $3 AND status = 'running';
The lease_owner = $3 predicate matters. If the lease has already been reclaimed and handed to someone else, this update matches nothing, and a worker that wakes up from a long stall cannot extend a lease it no longer holds.
Without a heartbeat the lease has to be longer than the longest job you will ever run, which means a worker that dies leaves its job stuck for that entire window. With one, the lease can be short — 30 seconds here — and still safe, because it only lapses when the worker genuinely stops renewing it.
Killing a worker to see what happens
Two workers, three jobs of 24 seconds each, a 10-second lease and a 3-second heartbeat. Both workers pick up a job, then I sent SIGKILL to whichever one held the first row.
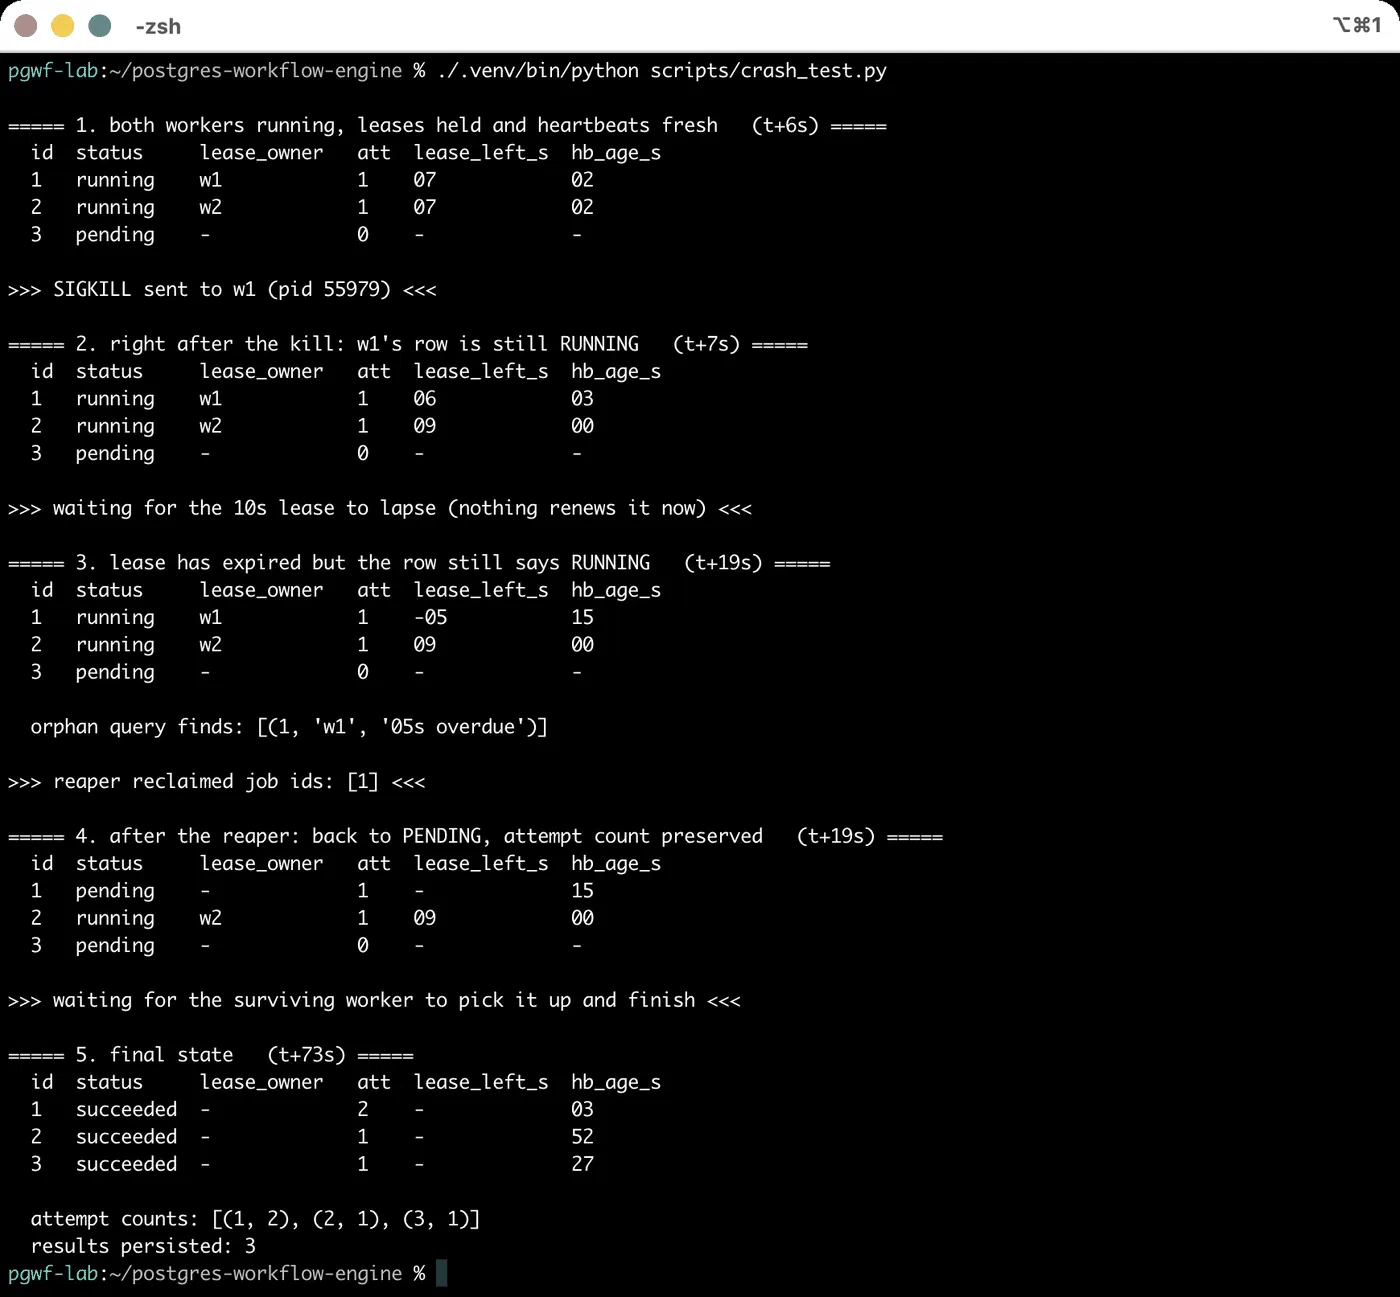
The whole sequence in one run: kill, orphan, lease expiry, reclaim, completion.
Six seconds in, both rows are held, both leases have about seven seconds left, and both heartbeats are two seconds old.
One second after the kill, nothing has changed. Job 1 still claims to be running, still names w2 as its owner, and its lease still has six seconds on it. This is the state that makes status = 'running' insufficient on its own: job 1’s owner no longer exists, and the row is indistinguishable from job 2, whose owner is fine.
Twelve seconds later they have separated, and the thing that separates them is the heartbeat rather than the status. Job 2’s lease still shows nine seconds remaining with a zero-second-old heartbeat, because w1 is alive and renewing it. Job 1’s lease is five seconds overdue and its heartbeat is fifteen seconds stale, because nothing has touched it since the process died. Orphan detection is then a plain predicate:
SELECT id, lease_owner, now() - lease_expires_at AS expired_for
  FROM jobs
 WHERE status = 'running' AND lease_expires_at < now();
which returned exactly one row: (1, 'w2', '05s overdue').
The reaper puts it back:
UPDATE jobs
   SET status = 'pending', available_at = now(), started_at = NULL,
       lease_owner = NULL, lease_expires_at = NULL,
       last_error = coalesce(last_error,'') ||
                    format('[lease expired, reclaimed from %s at %s] ',
                           lease_owner, now())
 WHERE status = 'running' AND lease_expires_at < now();
The row returns to pending with its attempt count intact, which matters: a job that has already burned an attempt should not get a fresh budget just because the worker holding it crashed. Otherwise a job that reliably kills its worker retries forever.
The surviving worker then picked it up and finished it. Final state: all three jobs succeeded, job 1 with attempt_count = 2, and three result rows.
Note that the reaper runs against the partial index on status = 'running', which holds one entry per in-flight job. It stays cheap regardless of table size.
Retries, backoff, and knowing when to stop
A failure updates the row rather than deleting it. There is no separate retry table and no separate dead-letter queue — available_at and status carry both.
-- still has attempts left: push it into the future
UPDATE jobs SET status='pending', last_error=$1, started_at=NULL,
       available_at = now() + make_interval(secs => $2),
       lease_owner=NULL, lease_expires_at=NULL
 WHERE id=$3;

-- attempts exhausted: stop, and keep the evidence
UPDATE jobs SET status='dead', completed_at=now(), last_error=$1,
       lease_owner=NULL, lease_expires_at=NULL
 WHERE id=$2;
Backoff is base * 2^(attempt-1) seconds, expressed entirely as a future available_at. No worker needs to know it is a retry; the claim query already filters on available_at <= now().
Three jobs: one that succeeds immediately, one that fails twice then succeeds, one that always fails with max_attempts = 3. After three worker passes the first is succeeded at 1/5 attempts, the flaky one is succeeded at 3/5, and the broken one is dead at 3/3 with model backend returned 503 still attached to the row.
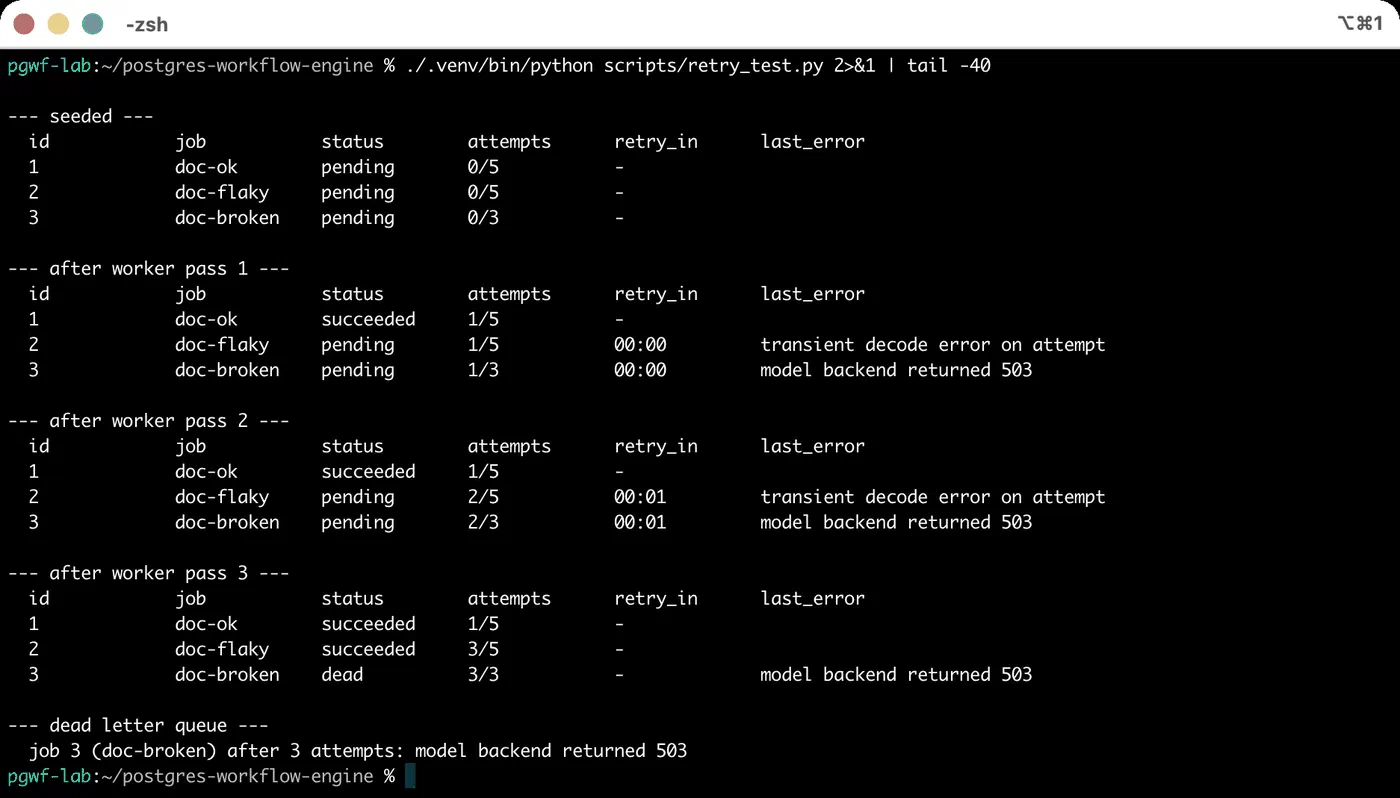
Three jobs, three outcomes. The attempts column and last_error are the whole audit trail.
The operational questions answer themselves once the state is in the table:
- What failed?
SELECT ... WHERE status = 'dead', withlast_errorattached. - Can I retry it? Set
status = 'pending',available_at = now(), and optionally raisemax_attempts. A dead job is a row, not a lost message. - Why did it stop? Because
attempt_countreachedmax_attempts— the row says so. - How do I avoid an infinite retry loop? The
deadstate is the answer, and it exists precisely so that “retry forever” is not the default.
Keeping dead jobs in the same table as live ones is deliberate. A separate dead-letter store is another thing to build, monitor, and reconcile, and the partial index means buried rows cost the claim query nothing.
Idempotency, not exactly-once
The design above delivers at least once. A job can run more than once, and the crash test showed exactly when: the worker finished the work but died before committing the status, so the lease lapsed and someone else ran it again. Nothing in PostgreSQL prevents that, because the expensive work happens outside the database and cannot be rolled back.
Exactly-once execution is not available here and it would be dishonest to imply otherwise. What is available is making the second execution harmless — the effect lands once even though the work ran twice.
The mechanism is a unique key on the effect, not on the job:
CREATE TABLE job_results (
    idempotency_key text PRIMARY KEY,
    job_id          bigint NOT NULL REFERENCES jobs(id),
    produced_by     text   NOT NULL,
    produced_at     timestamptz NOT NULL DEFAULT now(),
    result          jsonb  NOT NULL
);
and the completion writes through it:
INSERT INTO job_results (idempotency_key, job_id, produced_by, result)
VALUES ($1, $2, $3, $4)
ON CONFLICT (idempotency_key) DO NOTHING;
To check this behaves under the failure it is meant to survive, I ran a job to completion, forced its row back to pending — standing in for a worker that died after the work but before the commit — and let a second worker reclaim it. The second worker did the work again and then reported result already existed, skipped: its insert hit the conflict and did nothing. The job row ends at attempts=2 while job_results holds a single row for invoice-2026-000412, produced by worker-a.
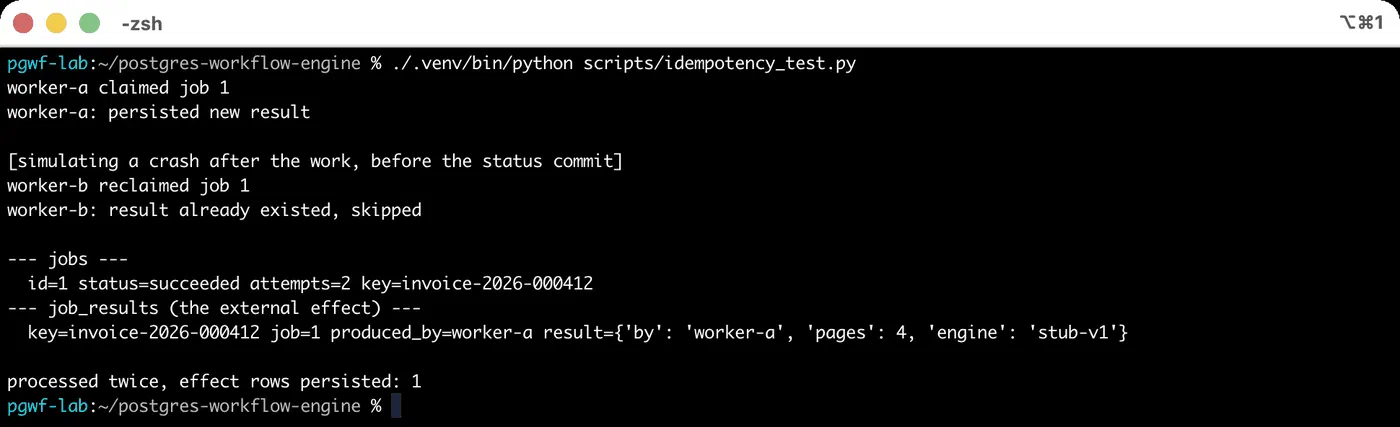
The job ran twice. The effect was written once.
attempts=2 is the honest record: the job really did run twice. One result row survives, and it is attributed to the worker that got there first.
Three terms worth keeping distinct:
- At least once — what this system guarantees. A job runs one or more times.
- Exactly once — what it does not guarantee, and what no system with an external side effect can guarantee on its own.
- Effectively once — at-least-once execution plus a uniqueness constraint on the effect, so repeats do not accumulate.
The important part is where the key comes from. invoice-2026-000412 is derived from the work, not generated by the worker, so two independent executions produce the same key. A UUID minted at claim time would produce two different keys and two rows, which is a constraint that looks like idempotency and provides none of it.
If the real side effect is outside PostgreSQL — a payment, an email, a write to another service — the same reasoning applies, and the idempotency key has to travel to that system so it can do the deduplication.
Operational visibility
This is the part that is hard to give up once you have had it. The queue is a table, so answering questions about it is just SQL.
-- how far behind are we, and what is the oldest thing waiting
SELECT count(*) AS ready_now, max(now() - created_at) AS oldest_wait
  FROM jobs WHERE status = 'pending' AND available_at <= now();

-- who is holding what, and how much lease is left
SELECT id, lease_owner, attempt_count,
       lease_expires_at - now() AS lease_remaining,
       now() - heartbeat_at     AS since_heartbeat
  FROM jobs WHERE status = 'running' ORDER BY lease_expires_at;

-- jobs burning through their attempts
SELECT id, attempt_count, max_attempts, available_at - now() AS retry_in,
       left(last_error, 60) AS last_error
  FROM jobs WHERE status = 'pending' AND attempt_count > 0
 ORDER BY attempt_count DESC;

-- the dead letter queue
SELECT id, attempt_count, completed_at, left(last_error, 80)
  FROM jobs WHERE status = 'dead' ORDER BY completed_at DESC;
since_heartbeat is the alert worth having. A growing heartbeat age on a running job means a worker is wedged rather than slow, and it fires before the lease expires rather than after.
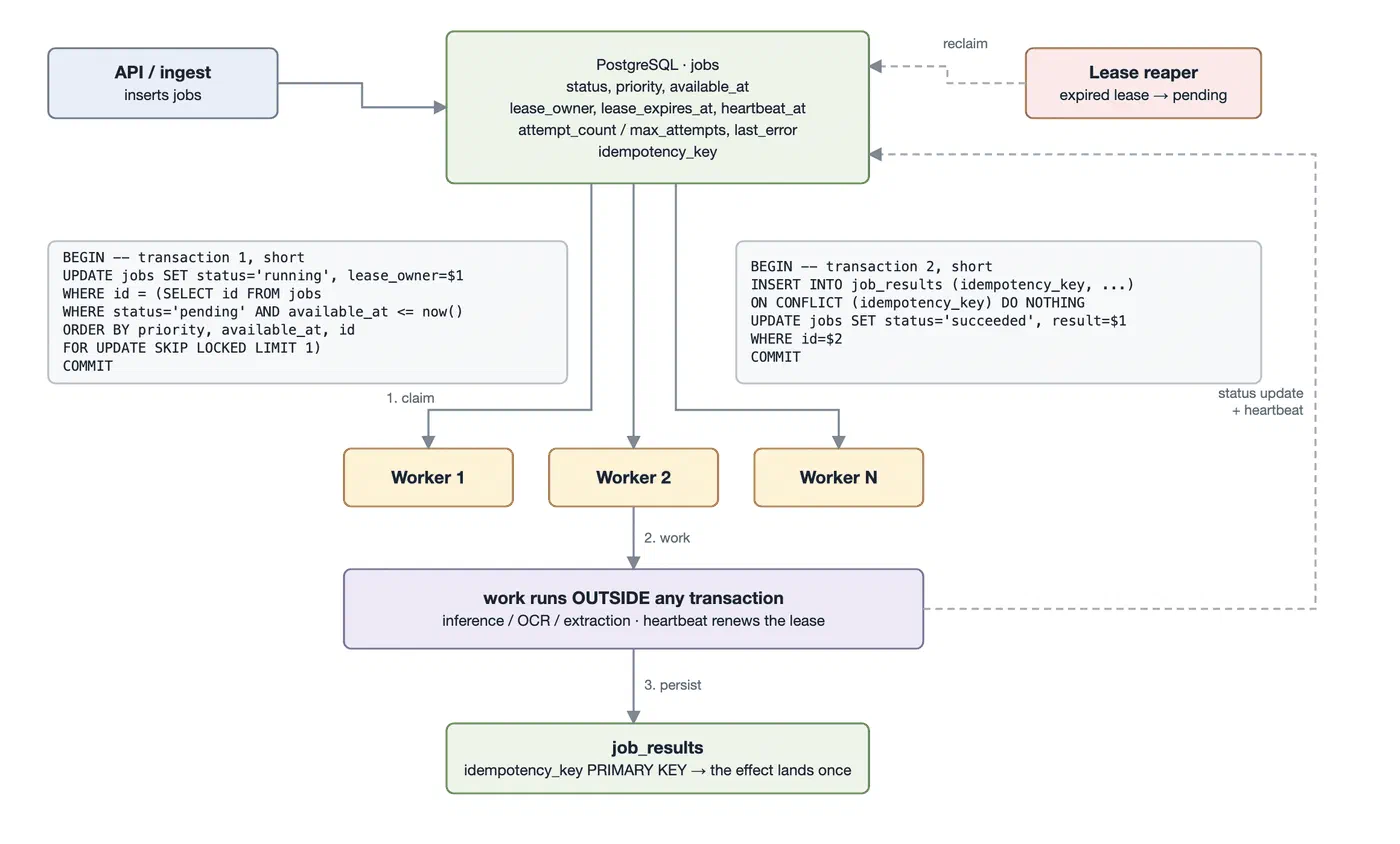
The finished shape. The two grey blocks are the only times a transaction is open.
Where this design holds up
On the evidence from this lab, a PostgreSQL-backed queue is a reasonable default when:
- Jobs are slow. The claim cost 1.68 ms against 200 ms of work. Against a 30-second inference call it disappears entirely. Coordination overhead only matters when the work is trivial, and this workload is the opposite.
- PostgreSQL is already in the stack. The queue adds one table, one partial index and a reaper. There is no new system to deploy, secure, upgrade, back up or learn.
- Job state and business data must agree. Marking a job complete and writing its output in one transaction removes an entire category of failure.
- You need to interrogate the backlog. Everything in the previous section is a
SELECT. - There is one logical consumer group. Work is distributed among workers, not broadcast to independent subscribers.
Where I would stop
The lab did not find a throughput wall, but it was not built to. These are the signals I would treat as a reason to move to a dedicated broker, and I want to be clear that they are architectural rather than measured here:
- Sustained high-rate event streams. This lab ran at tens of jobs per second with 200 ms jobs. A queue table at tens of thousands of events per second is a different problem, and one that pushes hard on vacuum and on index churn.
- Fan-out to many independent consumers. A
jobstable hands each row to one worker. Several unrelated systems that all need to see every event is a different shape, and emulating it with per-consumer state in SQL is a rebuild of a broker with worse tooling. - Replay. Kafka retains a log you can re-read from an offset. Once a queue row is processed it is a completed row; if you need “reprocess everything from last Tuesday”, the queue is not your event store.
- Retention semantics. A broker is designed to hold and expire a stream. A queue table holds rows until you delete them, and someone has to own that.
- Cross-system distribution. Once producers and consumers span teams and deployments, a broker is the integration contract. A shared queue table is shared internals.
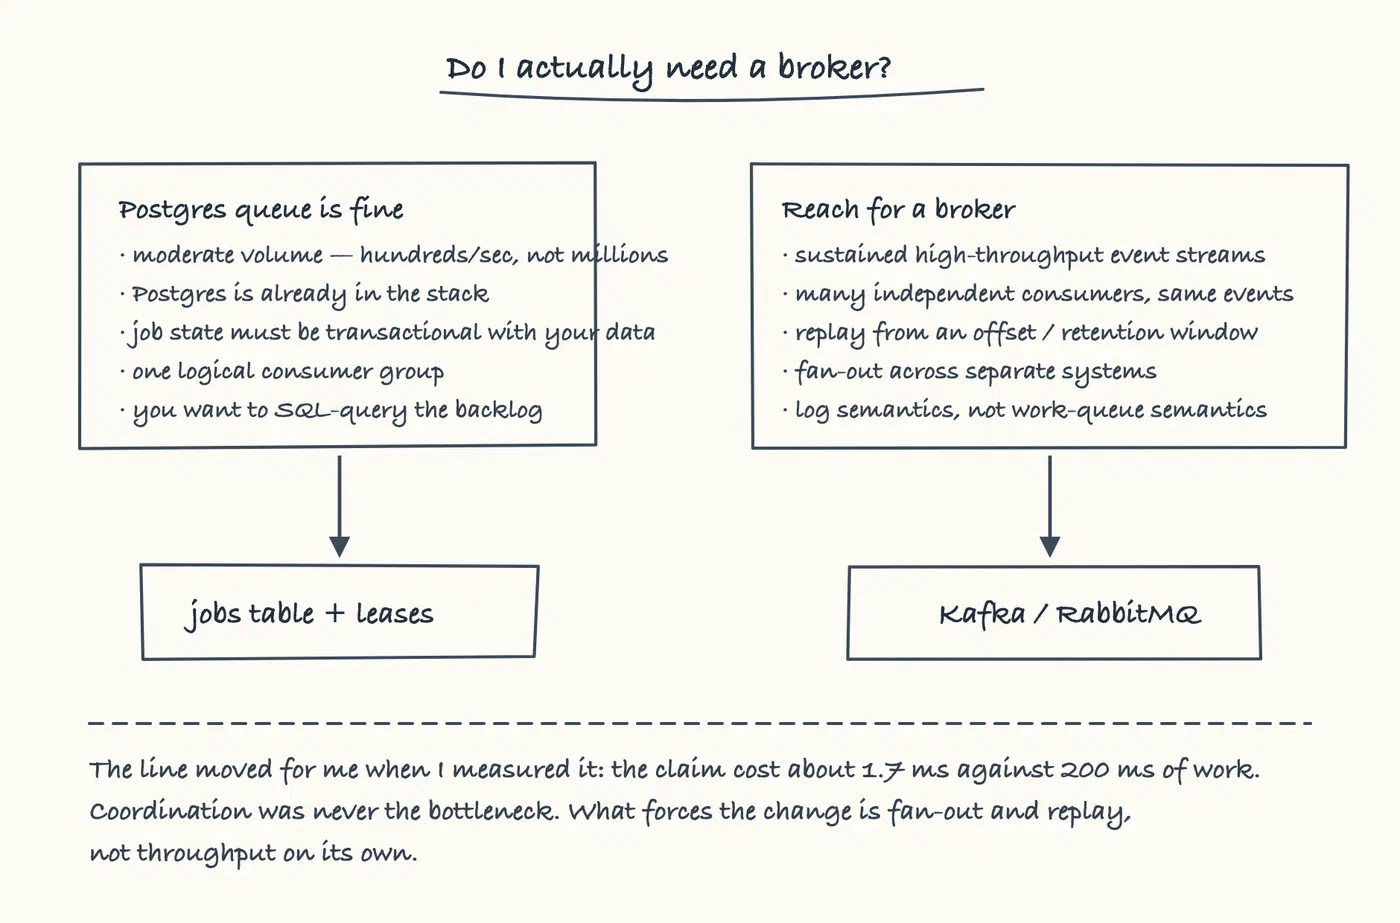
How I would decide it now.
The distinction that stayed with me is between a work queue and an event log. This design is a good work queue. It is not an event log, and most of the arguments for introducing Kafka are really arguments for an event log.
Two caveats about the numbers, so they are not carried further than they support. The work was time.sleep, so workers were never CPU-bound and 16 of them fit comfortably on 12 cores; real inference would compete for CPU and the scaling curve would bend earlier. And this is one laptop with one database and no replication, network hop, or connection pooler in the path. The measurements are about coordination behaviour and correctness, not about capacity on your hardware.
Conclusion
I set out to find where PostgreSQL stops being enough for coordinating long-running asynchronous work, and I did not find that wall on this workload. What I found instead was that the interesting failures are not about throughput at all.
The naive claim was the sharpest result: not a rare race but 886 wasted job executions out of 400 jobs at 16 workers, with a corrupted attempt_count on top, and PostgreSQL reporting complete success throughout. FOR UPDATE SKIP LOCKED fixed it exactly, with zero duplicates at every worker count and scaling within 2% of linear.
The transaction-scope question was the one that taught me most, because the benchmark argued the wrong way. Holding the transaction open across the work was slightly faster. The cost only appeared when I stopped measuring throughput and looked at connection state: eight connections pinned in idle in transaction, and an open transaction whose duration tracks job length linearly. That cost is invisible at 200 ms and severe at 60 seconds, which is precisely the workload this design is for.
And the partial index is the one thing I would not build without. Same query, same backlog: 0.02 ms and four buffers with it, 27.6 ms and 10,216 buffers without, on a table that was 99.9% history.
If your jobs are slow, your volume is moderate, and PostgreSQL is already running, the queue table is a legitimate architecture rather than a stepping stone — provided you take the short claim transaction, the lease with heartbeats, the idempotent effect and the dead-letter state as a package. Skip any one of them and you have built something that works in testing and loses jobs in production. Reach for a broker when you need fan-out, replay or retention, not because a queue in the database feels like cheating.
Reproducing this
| Component | Version |
|---|---|
| Hardware | Apple M2 Pro, 12 cores, 16 GB |
| OS | macOS 26.4 (arm64) |
| Database | Percona Server for PostgreSQL 18.6.1 (PostgreSQL 18.6), official container image |
| Container runtime | Docker Desktop 29.3.1, VM limited to 12 CPUs / ~8 GB |
| Client | Python 3.12.13, psycopg 3.3.5 |
| PostgreSQL config | image defaults, unmodified |
| Workload | 400 jobs, 200 ms simulated work, workers 1/2/4/8/16 |
| Lease / heartbeat | 30 s lease, renewed every 3–5 s (10 s lease in the crash test) |
| Retries | max_attempts 5, backoff 1s * 2^(attempt-1) |
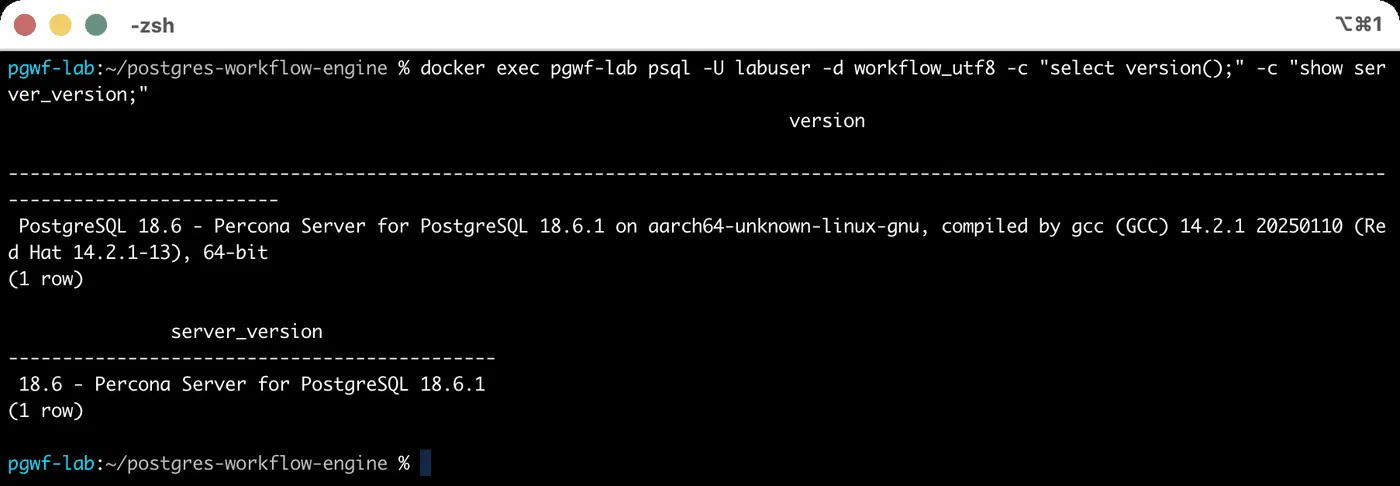
The database under test.
One trap worth flagging: the official image initialises its default database as SQL_ASCII. Under that encoding psycopg 3 returns bytes rather than str for text columns, so status::text comes back as b'succeeded' and every comparison against 'succeeded' silently fails. The lab uses a database created explicitly with ENCODING 'UTF8' TEMPLATE template0.
Timings are measured from the database — first claim to last completion — rather than from the wall clock around the worker processes, because workers idle briefly before exiting and that idle time inflated the fast runs by up to 30%.
References
- PostgreSQL documentation, Row-Level Locking —
FOR UPDATE,SKIP LOCKEDandNOWAITsemantics - PostgreSQL documentation, Transaction Isolation — Read Committed behaviour, which is what makes the naive claim unsafe
- PostgreSQL documentation, Partial Indexes
- PostgreSQL documentation, Routine Vacuuming — why long-running transactions delay cleanup
- PostgreSQL documentation,
INSERT ... ON CONFLICT - psycopg 3 documentation
- Percona Distribution for PostgreSQL documentation
This post is part of the Percona Community Writers Program. ∎



Discussion
We invite you to our forum for discussion. You are welcome to use the widget below.