


DuckDB Speed on MySQL with dbtrail, Without a New Storage Engine

Two recent posts on the Percona blog caught my attention. In Replicating from InnoDB into a DuckDB storage engine and The DuckDB MySQL engine at 500 GB, Evgeniy Patlan wired DuckDB into mysqld as a storage engine, pointed row-based replication at it, and measured it at TPC-H scale factor 500. The numbers are striking: loads 25 times faster than InnoDB, one fifth of the disk, and the full 22-query TPC-H suite done in 186 seconds where InnoDB needed about 28 hours and never finished four of the queries.
The posts are also honest about the cost. The work is experimental. The worst bug found was silent data loss on every replicated transaction: the two-phase commit code for mixed-engine transactions dropped prepared DuckDB transactions before they committed, so replication reported success while no rows persisted. The test harness caught it and it was fixed. The row-by-row applier also cannot keep up with bulk writes on the primary.
I want to add a second road to the same place, one that changes nothing inside mysqld. Disclosure first: I build dbtrail, the Apache 2.0 open source tool used below, so read this as one more point in the design space, from someone who is not neutral. Everything here ran on stock Percona Server 8.0 from Docker Hub and stock DuckDB from Homebrew, and the commands at the end reproduce all of it.
Your binlog is already a columnar feed
The storage engine approach puts the column store inside the server, so the server must cooperate: a patched build, a new engine in the commit path, replica tables created by hand with ENGINE=DuckDB. The other road starts from what MySQL already provides. With binlog_format=ROW and binlog_row_image=FULL, the binary log is a complete, ordered feed of every row change, with full before and after images. Any process can consume that feed as a replication client, the way a replica does, and install nothing on the server.
dbtrail is that process. It does two things with the feed:
- It keeps a short, searchable window of recent events in a plain MySQL table, for investigation and recovery.
- It moves closed hours out to Parquet files, the open columnar format every analytical engine can read. DuckDB reads it natively.
The pipeline is mysqld -> binlog -> Parquet -> DuckDB. No patched server, no plugin, nothing new in the commit path. And because the feed is history rather than current state, dbtrail can answer a question no replica can: what did this row look like before, and how do I undo what happened to it?
The demo
One container for the source, stock image, with the settings any change-capture consumer needs (plus one line to keep the demo’s own index out of the binlog, since source and index share one server here):
docker run -d --name demo -p 13310:3306 -e MYSQL_ROOT_PASSWORD=demo \
  percona/percona-server:8.0 \
  --gtid-mode=ON --enforce-gtid-consistency=ON \
  --binlog-rows-query-log-events=ON --binlog-ignore-db=bintrail_index
binlog_format=ROW and binlog_row_image=FULL are already the 8.0 defaults. The schema is a small shop: customers, orders, order_items. Three short commands point dbtrail at it (init, snapshot, stream; they are in the last section), and from there the work happens in dbtrail’s web console. Then I replayed a five-hour synthetic workload: 3,265,000 row events in all. 2.7 million INSERTs, 510 thousand UPDATEs, 55 thousand DELETEs. (A tip for demo builders: SET TIMESTAMP = <unix_time> in the writing session backdates the binlog event timestamps, so a fast replay spreads across past hours and you can watch retention behave as it would in real life.)
The console’s Status view answers the first question an operator should ask of any change-capture pipeline: did we miss anything?
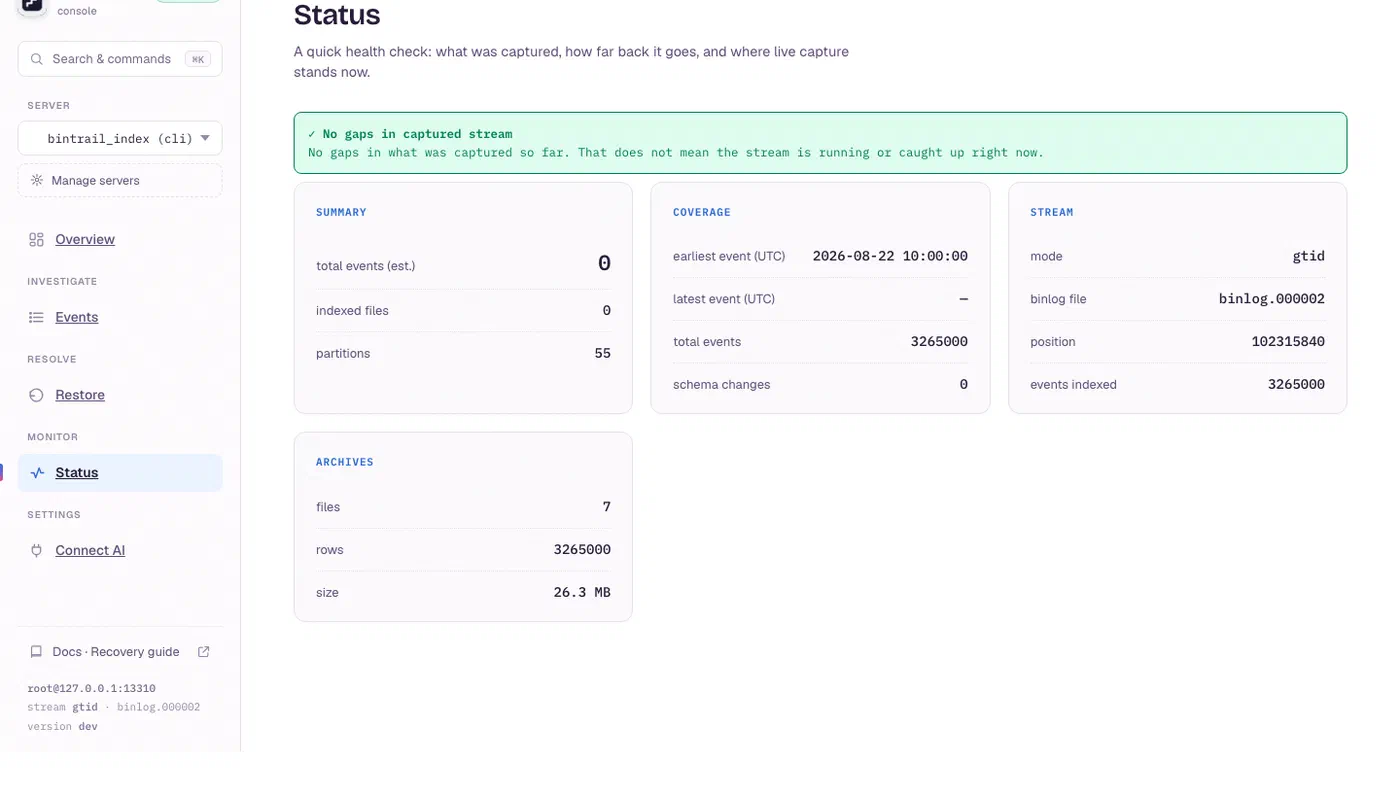
The green banner is a verdict, not a guess: dbtrail tracks continuity across the captured range, and it says plainly that this is not a liveness check. On my MacBook the capture stream held about 18,000 events per second while it tailed the binlog. That answers the applier problem from the first post: dbtrail does not push rows through the storage engine API one at a time, it batches them into an index, so bulk writes on the primary are absorbed rather than queued.
From hot partitions to Parquet
The index table is range-partitioned by hour. dbtrail archives each closed hour to zstd-compressed Parquet, checks the result, and only then drops the partition. Retention on the expensive tier becomes hours, not months. The demo moved all 3.26 million events out in 14 seconds, and the Status view above already showed the result: 7 archive files, 26 MB. Here is that number next to what the same events cost in InnoDB:
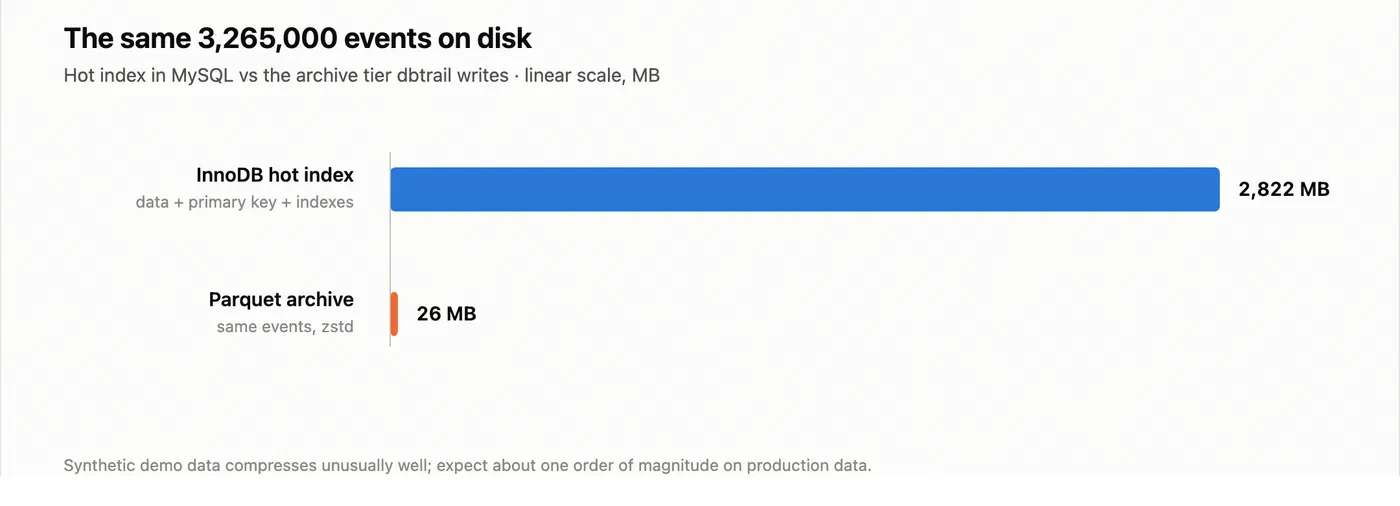
Do not take that 100x as a general truth. Synthetic demo data repeats itself and compresses far too well, and the InnoDB figure includes the primary key and secondary indexes that make the hot tier searchable. On production data expect about one order of magnitude. The direction matches what Evgeniy measured at 500 GB, where the DuckDB engine held TPC-H in 26 percent of the raw CSV size and InnoDB needed 135 percent. Column formats fit this data. Row formats do not.
One mydumper pass adds the state side: a baseline snapshot of the tables themselves, also stored as Parquet. For the demo shop that was 2.6 million rows in 8 MB, done in under four seconds. dbtrail uses baselines to rebuild full tables and single rows at a point in time; here they also give DuckDB something current to query.
Stock DuckDB, no plugins
The archive is just files, so the query engine does not have to be dbtrail. One command, bintrail views (bintrail is the name of dbtrail’s CLI binary), writes a single SQL file of DuckDB view definitions over the layout it knows about: an events view across every archived partition, and one state_<schema>_<table> view per table of the newest baseline:
bintrail views --index-dsn "$IDX" --baseline-dir /data/baselines --out views.sql
duckdb
D .read views.sql
That is the whole integration. dbtrail never opens DuckDB and never runs what it prints; the file is plain SQL you can read before you use it. From there, use any DuckDB you like: the CLI, a notebook, a BI tool’s connector. Same laptop, same data, same queries on both engines:
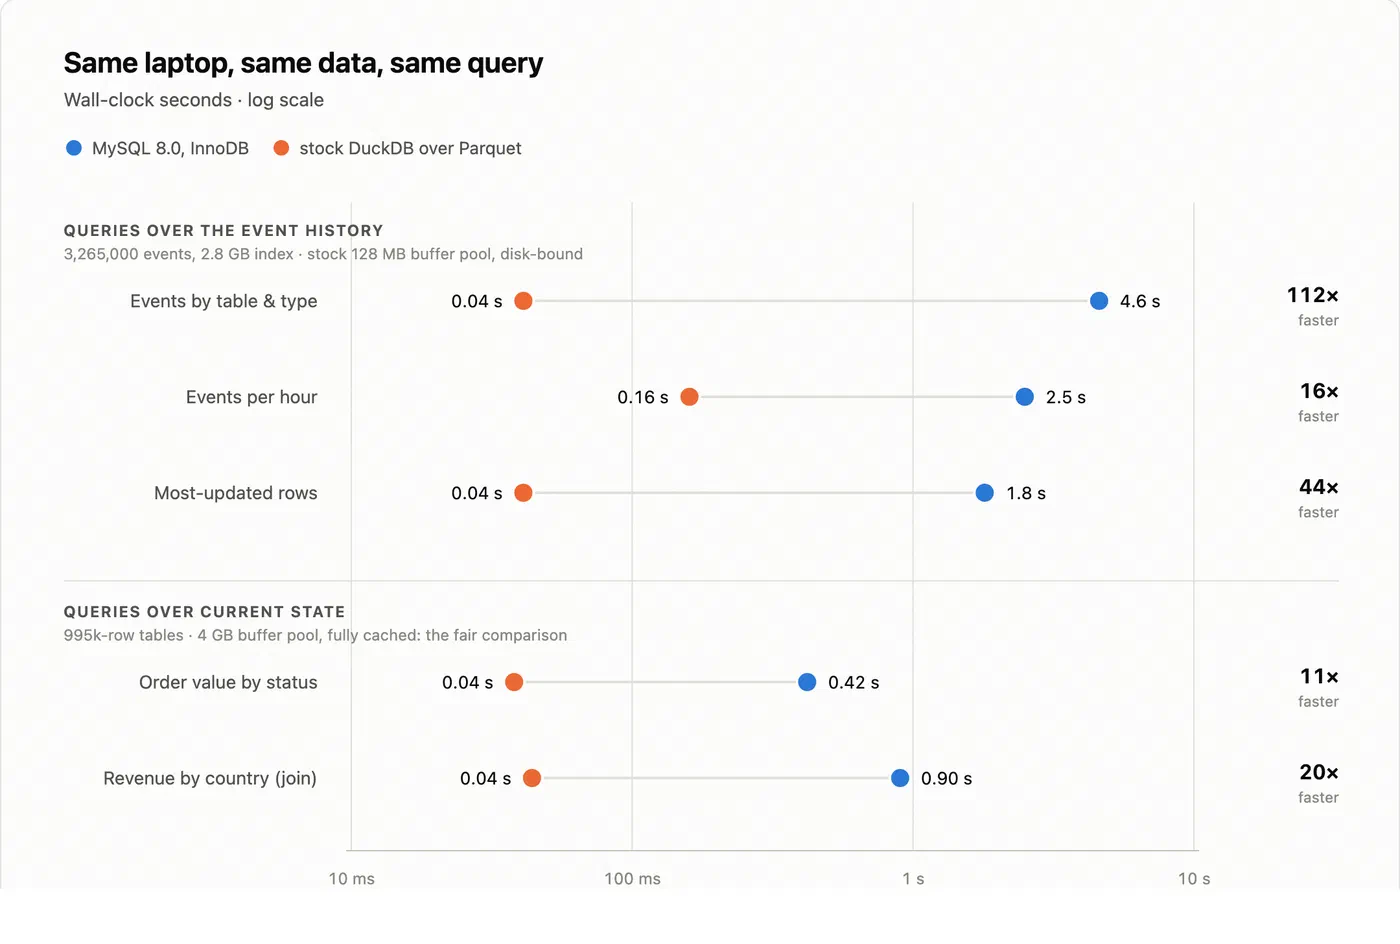
Now the fine print, because a benchmark without it is just marketing. The chart has two groups. The first group queries the event history: those scans hit a 2.8 GB index with the container’s stock 128 MB buffer pool, so InnoDB paid for disk reads, and a bigger pool narrows that gap. The second group runs over current state and is the fair comparison: I grew the pool to 4 GB, both tables sat fully in cache, and the 11x and 20x that remain come from the design of the engine, not from the disk. Both engines returned the same results, down to the last decimal. That is a free integrity check: two independent systems read the same history and agreed.
These are laptop numbers, and I did not run TPC-H. For the ceiling of what columnar execution does at 500 GB, read Evgeniy’s second post. My point is the floor: 2.8 GB of freshly rotated history sat on my laptop as 26 MB of open files, and a stock engine answers questions over them in tens of milliseconds. Nobody patched anything to get here.
The part a replica cannot do
A DuckDB replica holds current state. dbtrail holds what happened. This is the same data the analytics just scanned, now in the console’s Events view, filtered to one order:
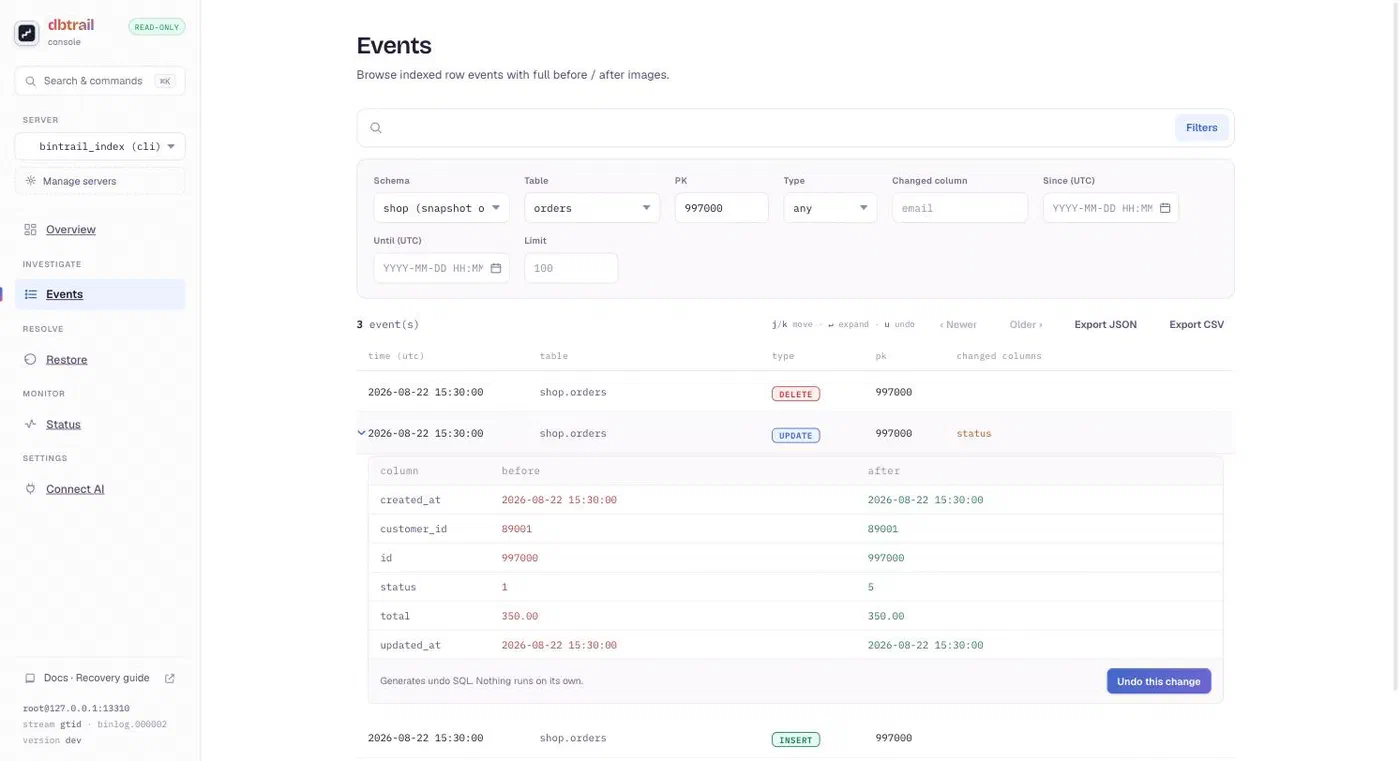
Three events tell the row’s whole story: created, cancelled, deleted, each with its GTID and the connection that did it. The expanded UPDATE shows the full before and after images dbtrail keeps for every change.
Here is the detail that surprises people: when I took that screenshot, the MySQL side of the index held zero rows. Rotation had dropped every partition. The console read the answer from the Parquet tier in under 200 milliseconds. The Undo button works from there too:
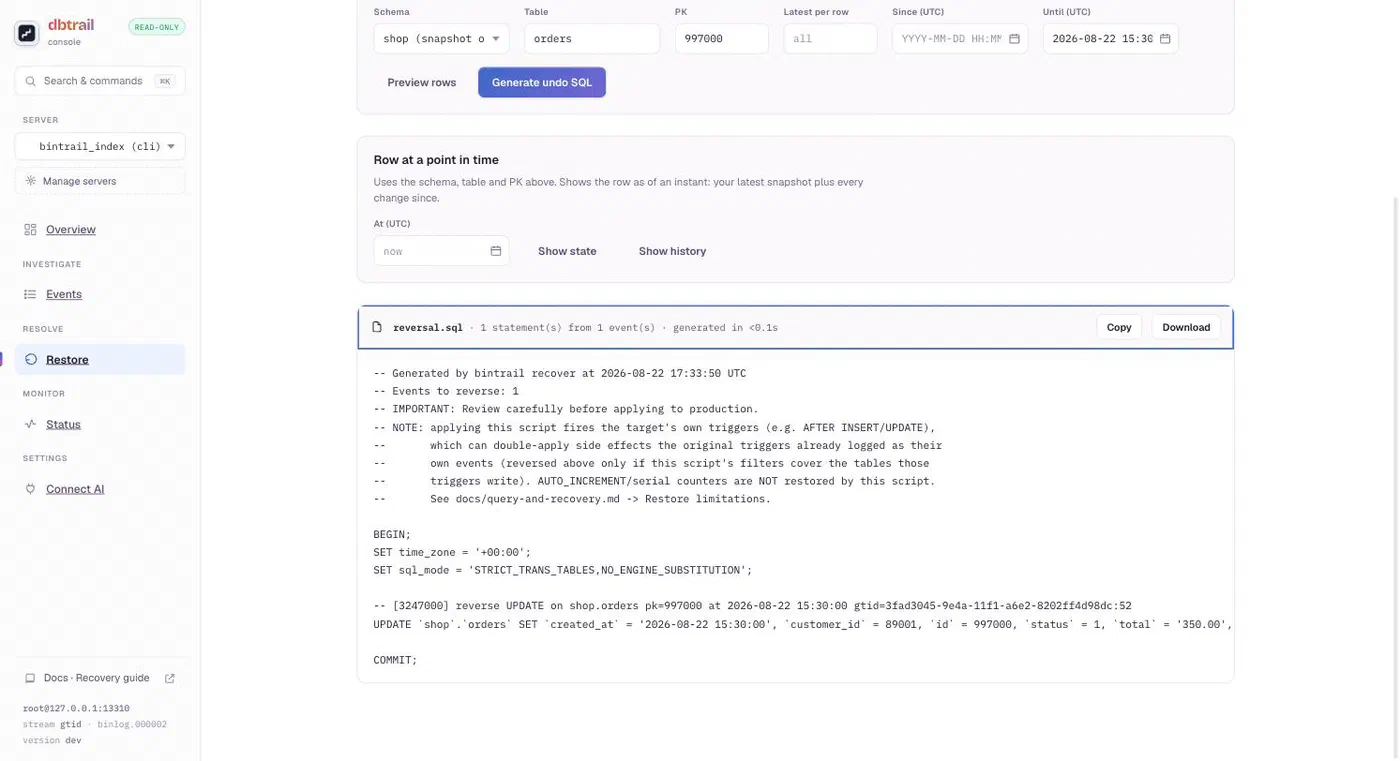
One click wrote reversal.sql: a script that puts the row back exactly as it was, tagged with the GTID it reverses. Nothing runs on its own; you read the script, then you apply it. The same Restore view takes a whole table and a time window: the demo’s 5,000 deleted orders came back as 5,000 INSERT statements, generated in 0.2 seconds, from files, while the database that held that history no longer existed.
A column store fed by your binlog does not have to be a replica. It can be a time machine.
Trade-offs, honestly
Neither road wins outright.
Where the storage engine is better: its DuckDB copy is always current, and it speaks MySQL protocol. A DuckDB engine on a replica runs seconds behind the primary, and existing BI tools connect to it unchanged. dbtrail’s capture also runs seconds behind, and its console and CLI query that fresh index directly. What waits is the copy DuckDB reads: the events view covers the hours already rotated to Parquet, and the state views show the latest baseline, so that side is as current as your rotation and baseline schedule. If you need a BI tool on MySQL protocol reading a complete, current copy, Evgeniy’s architecture, or a product like HeatWave, aims at exactly that.
Where staying outside the server is better: risk and history. The hardest place to change a database is the commit path, and a storage engine lives there. The 2PC bug shows the kind of failure that layer produces, and it took a dedicated test harness to find it, because it was silent. A replication client cannot corrupt a commit. Its failure modes are lag and gaps, and dbtrail reports gaps as a first-class verdict rather than hoping. History is the other half: audit, point-in-time rebuilds, and row-level undo all come from the same files the analytics read.
Shared constraints. Both roads need ROW format with FULL row images. Both need primary keys to apply or reverse UPDATEs and DELETEs. Both leave the source of truth in InnoDB, untouched. On maturity: the engine posts describe an experiment and say so; dbtrail is released and versioned (v0.65.0 as I write this) but young, and you should question my numbers the same way I question everyone else’s.
Both posts and this one agree on the base facts: row stores are the wrong shape for analytical scans, DuckDB fits MySQL-shaped data well, and the open question is where the column store should live. Evgeniy shows what you gain when the server cooperates. dbtrail shows what you get when you leave the server alone.
Reproduce it
dbtrail binaries are on the releases page; DuckDB comes from your package manager. The web console ships as its own binary, bintrail-console, and can also run capture and console together as one daemon (bintrail-console watch).
# 1. A source with binlogs (ROW + FULL are 8.0 defaults)
docker run -d --name demo -p 13310:3306 -e MYSQL_ROOT_PASSWORD=demo \
  percona/percona-server:8.0 --gtid-mode=ON --enforce-gtid-consistency=ON \
  --binlog-rows-query-log-events=ON --binlog-ignore-db=bintrail_index

# 2. Create your schema, then point dbtrail at it
bintrail init     --index-dsn "$IDX"
bintrail snapshot --source-dsn "$SRC" --index-dsn "$IDX" --schemas shop
bintrail stream   --source-dsn "$SRC" --index-dsn "$IDX" --server-id 4444 --schemas shop &
bintrail-console serve --index-dsn "$IDX" --baseline-dir /data/baselines &

# 3. Run your workload, then tier the history out and take a baseline
bintrail rotate   --index-dsn "$IDX" --retain 7d --archive-dir /data/archives
bintrail dump     --source-dsn "$SRC" --output-dir /data/dump --schemas shop
bintrail baseline --input /data/dump --output /data/baselines

# 4. Hand the whole thing to DuckDB
bintrail views --index-dsn "$IDX" --baseline-dir /data/baselines --out views.sql
duckdb -c ".read views.sql" \
       -c "SELECT table_name, event_type, COUNT(*) FROM events GROUP BY 1,2;"
If you try dbtrail, tell me where it fails as much as where it works well. Issues and pull requests are open at github.com/dbtrail/dbtrail, and I am around in the Percona Community Slack. ∎



Discussion
We invite you to our forum for discussion. You are welcome to use the widget below.