%22%3E%3Cpath%20d=%22M352.016%20109.322h-18.62v33.317H308.887V31.542h45.54c26.587.0%2042.669%2015.7006%2042.669%2038.4065V70.2514c0%2025.715-20.051%2039.0416-45.051%2039.0416L352.016%20109.322v0zm20.207-38.885C372.223%2059.4847%20364.589%2053.6128%20352.32%2053.6128H333.367V87.5641H352.78c12.27.0%2019.414-7.3081%2019.414-16.8242V70.437H372.223z%22%20fill=%22%23fff%22/%3E%3Cpath%20d=%22M410.776%20142.648V31.542H494.84V53.3001H435.139V75.8497h52.527V97.6078H435.139V120.949h60.494v21.758H410.776V142.648v0z%22%20fill=%22%23fff%22/%3E%3Cpath%20d=%22M582.46%20142.648%20558.588%20107.104H539.331v35.544H514.822V31.542h50.939c26.284.0%2042.032%2013.815%2042.032%2036.6674V68.5123c0%2017.9282-9.702%2029.2128-23.872%2034.4497L611.145%20142.639H582.451L582.46%20142.648zM582.95%2069.4893C582.95%2059.0255%20575.62%2053.603%20563.694%2053.603H539.341V85.5026h24.843C576.12%2085.5026%20582.95%2079.1422%20582.95%2069.8019V69.4991%2069.4893z%22%20fill=%22%23fff%22/%3E%3Cpath%20d=%22M678.058%20145.618c-33.221.0-57.907-25.568-57.907-57.9171V87.3882C620.151%2055.3812%20644.337%2029.1678%20679.048%2029.1678c21.285.0%2034.055%207.0639%2044.54%2017.3616L707.781%2064.6922C699.059%2056.7979%20690.21%2051.9909%20678.891%2051.9909c-19.021.0-32.761%2015.7593-32.761%2035.0652V87.3687c0%2019.3063%2013.397%2035.3683%2032.761%2035.3683C691.788%20122.737%20699.706%20117.588%20708.585%20109.537l15.807%2015.916C712.76%20137.851%20699.863%20145.56%20678.088%20145.56L678.058%20145.618z%22%20fill=%22%23fff%22/%3E%3Cpath%20d=%22M789.963%20145.618c-34.858.0-59.858-25.9-59.858-57.9171V87.3882c0-32.007%2025.333-58.2204%2060.162-58.2204%2034.829.0%2059.858%2025.9007%2059.858%2057.9176V87.398c0%2032.007-25.333%2058.22-60.162%2058.22zm34.212-58.22C824.175%2068.0922%20809.975%2052.03%20789.963%2052.03%20769.952%2052.03%20756.095%2067.7893%20756.095%2087.0951V87.4078C756.095%20106.714%20770.295%20122.776%20790.306%20122.776%20810.318%20122.776%20824.175%20107.017%20824.175%2087.7107V87.398v0z%22%20fill=%22%23fff%22/%3E%3Cpath%20d=%22M985.089%20142.736%201039.93%2029.1678%201094.77%20142.746h-27.5L1039.93%2086.2256l-27.24%2056.5204H985.089V142.736z%22%20fill=%22%23fff%22/%3E%3Cpath%20d=%22M974.936%2031.5811V145.628L891.304%2078.0968V142.551H865.285V29.1678L948.917%2096.4354V31.5811h26.019z%22%20fill=%22%23fff%22/%3E%3C/g%3E%3Cpath%20d=%22M219.315%20146.829c28.718-18.788%2038.114-57.1102%2020.735-87.2301-8.708-15.108-22.784-25.9277-39.624-30.4456-15.602-4.1923-31.898-2.478-46.241%204.7743L134.603.0%2093.9541%2070.4613.0%20233.311H269.206l-49.891-86.482zM195.821%2046.4134c12.241%203.263%2022.427%2011.1294%2028.771%2022.0826%2012.47%2021.5912%205.993%2048.977-14.23%2062.808L163.128%2049.4361c10.176-4.8971%2021.653-5.9652%2032.693-3.0227zM134.603%2035.7593%20238.247%20215.426H177.605L104.268%2088.3409l30.329-52.5762L134.603%2035.7593zM30.9588%20215.426l62.99-109.168L156.939%20215.426H30.9588z%22%20fill=%22url(%23paint0_linear_1391_11470)%22/%3E%3Cpath%20d=%22M306.655%20202.335C306.655%20196.555%20307.958%20191.37%20310.565%20186.78%20313.172%20182.133%20316.713%20178.507%20321.19%20175.9%20325.723%20173.293%20330.738%20171.99%20336.235%20171.99%20342.695%20171.99%20348.333%20173.548%20353.15%20176.665%20357.967%20179.782%20361.48%20184.202%20363.69%20189.925H354.425C352.782%20186.355%20350.402%20183.607%20347.285%20181.68%20344.225%20179.753%20340.542%20178.79%20336.235%20178.79%20332.098%20178.79%20328.387%20179.753%20325.1%20181.68%20321.813%20183.607%20319.235%20186.355%20317.365%20189.925%20315.495%20193.438%20314.56%20197.575%20314.56%20202.335%20314.56%20207.038%20315.495%20211.175%20317.365%20214.745%20319.235%20218.258%20321.813%20220.978%20325.1%20222.905%20328.387%20224.832%20332.098%20225.795%20336.235%20225.795%20340.542%20225.795%20344.225%20224.86%20347.285%20222.99%20350.402%20221.063%20352.782%20218.315%20354.425%20214.745H363.69C361.48%20220.412%20357.967%20224.803%20353.15%20227.92%20348.333%20230.98%20342.695%20232.51%20336.235%20232.51%20330.738%20232.51%20325.723%20231.235%20321.19%20228.685%20316.713%20226.078%20313.172%20222.48%20310.565%20217.89%20307.958%20213.3%20306.655%20208.115%20306.655%20202.335zm130.259%2030.26C431.418%20232.595%20426.403%20231.32%20421.869%20228.77%20417.336%20226.163%20413.738%20222.565%20411.074%20217.975%20408.468%20213.328%20407.164%20208.115%20407.164%20202.335S408.468%20191.37%20411.074%20186.78C413.738%20182.133%20417.336%20178.535%20421.869%20175.985%20426.403%20173.378%20431.418%20172.075%20436.914%20172.075%20442.468%20172.075%20447.511%20173.378%20452.044%20175.985%20456.578%20178.535%20460.148%20182.105%20462.754%20186.695%20465.361%20191.285%20466.664%20196.498%20466.664%20202.335%20466.664%20208.172%20465.361%20213.385%20462.754%20217.975%20460.148%20222.565%20456.578%20226.163%20452.044%20228.77%20447.511%20231.32%20442.468%20232.595%20436.914%20232.595zm0-6.715C441.051%20225.88%20444.763%20224.917%20448.049%20222.99%20451.393%20221.063%20453.999%20218.315%20455.869%20214.745%20457.796%20211.175%20458.759%20207.038%20458.759%20202.335%20458.759%20197.575%20457.796%20193.438%20455.869%20189.925%20453.999%20186.355%20451.421%20183.607%20448.134%20181.68%20444.848%20179.753%20441.108%20178.79%20436.914%20178.79%20432.721%20178.79%20428.981%20179.753%20425.694%20181.68%20422.408%20183.607%20419.801%20186.355%20417.874%20189.925%20416.004%20193.438%20415.069%20197.575%20415.069%20202.335%20415.069%20207.038%20416.004%20211.175%20417.874%20214.745%20419.801%20218.315%20422.408%20221.063%20425.694%20222.99%20429.038%20224.917%20432.778%20225.88%20436.914%20225.88zm134.906-52.7V232H564.085V188.14L544.535%20232H539.095L519.46%20188.055V232H511.725V173.18H520.055L541.815%20221.8l21.76-48.62H571.82zm108.063.0V232H672.148V188.14L652.598%20232H647.158l-19.635-43.945V232H619.788V173.18H628.118l21.76%2048.62%2021.76-48.62H679.883zM735.416%20172.755V210.24C735.416%20215.51%20736.691%20219.42%20739.241%20221.97%20741.848%20224.52%20745.446%20225.795%20750.036%20225.795%20754.57%20225.795%20758.111%20224.52%20760.661%20221.97%20763.268%20219.42%20764.571%20215.51%20764.571%20210.24V172.755H772.306v37.4C772.306%20215.085%20771.315%20219.25%20769.331%20222.65%20767.348%20225.993%20764.656%20228.487%20761.256%20230.13%20757.913%20231.773%20754.145%20232.595%20749.951%20232.595%20745.758%20232.595%20741.961%20231.773%20738.561%20230.13%20735.218%20228.487%20732.555%20225.993%20730.571%20222.65%20728.645%20219.25%20727.681%20215.085%20727.681%20210.155v-37.4H735.416zM866.64%20232H858.905l-31.11-47.175V232H820.06V172.67H827.795l31.11%2047.09V172.67H866.64V232zm55.77-59.245V232H914.675V172.755H922.41zm84.5.0V179.045H990.758V232H983.023V179.045H966.788V172.755h40.122zm85.85.0-19.3%2036.89V232H1065.73V209.645L1046.35%20172.755H1054.93L1069.55%20202.76%201084.17%20172.755H1092.76z%22%20fill=%22%23fff%22/%3E%3Cdefs%3E%3ClinearGradient%20id=%22paint0_linear_1391_11470%22%20x1=%2230.363%22%20y1=%22238.463%22%20x2=%22230.327%22%20y2=%2238.6685%22%20gradientUnits=%22userSpaceOnUse%22%3E%3Cstop%20stop-color=%22%23FC3519%22/%3E%3Cstop%20offset=%221%22%20stop-color=%22%23F0D136%22/%3E%3C/linearGradient%3E%3CclipPath%20id=%22clip0_1391_11470%22%3E%3Crect%20width=%22962.614%22%20height=%22116.656%22%20fill=%22%23fff%22%20transform=%22translate(132.155%2028.9724)%22/%3E%3C/clipPath%3E%3C/defs%3E%3C/svg%3E)
Introduction
Many MySQL setups begin life with a familiar incantation:
innodb_buffer_pool_size = 70% of RAM…and then nothing changes.
That’s not tuning. That’s a starting guess.
Real tuning starts when the workload pushes back.
Visual Overview
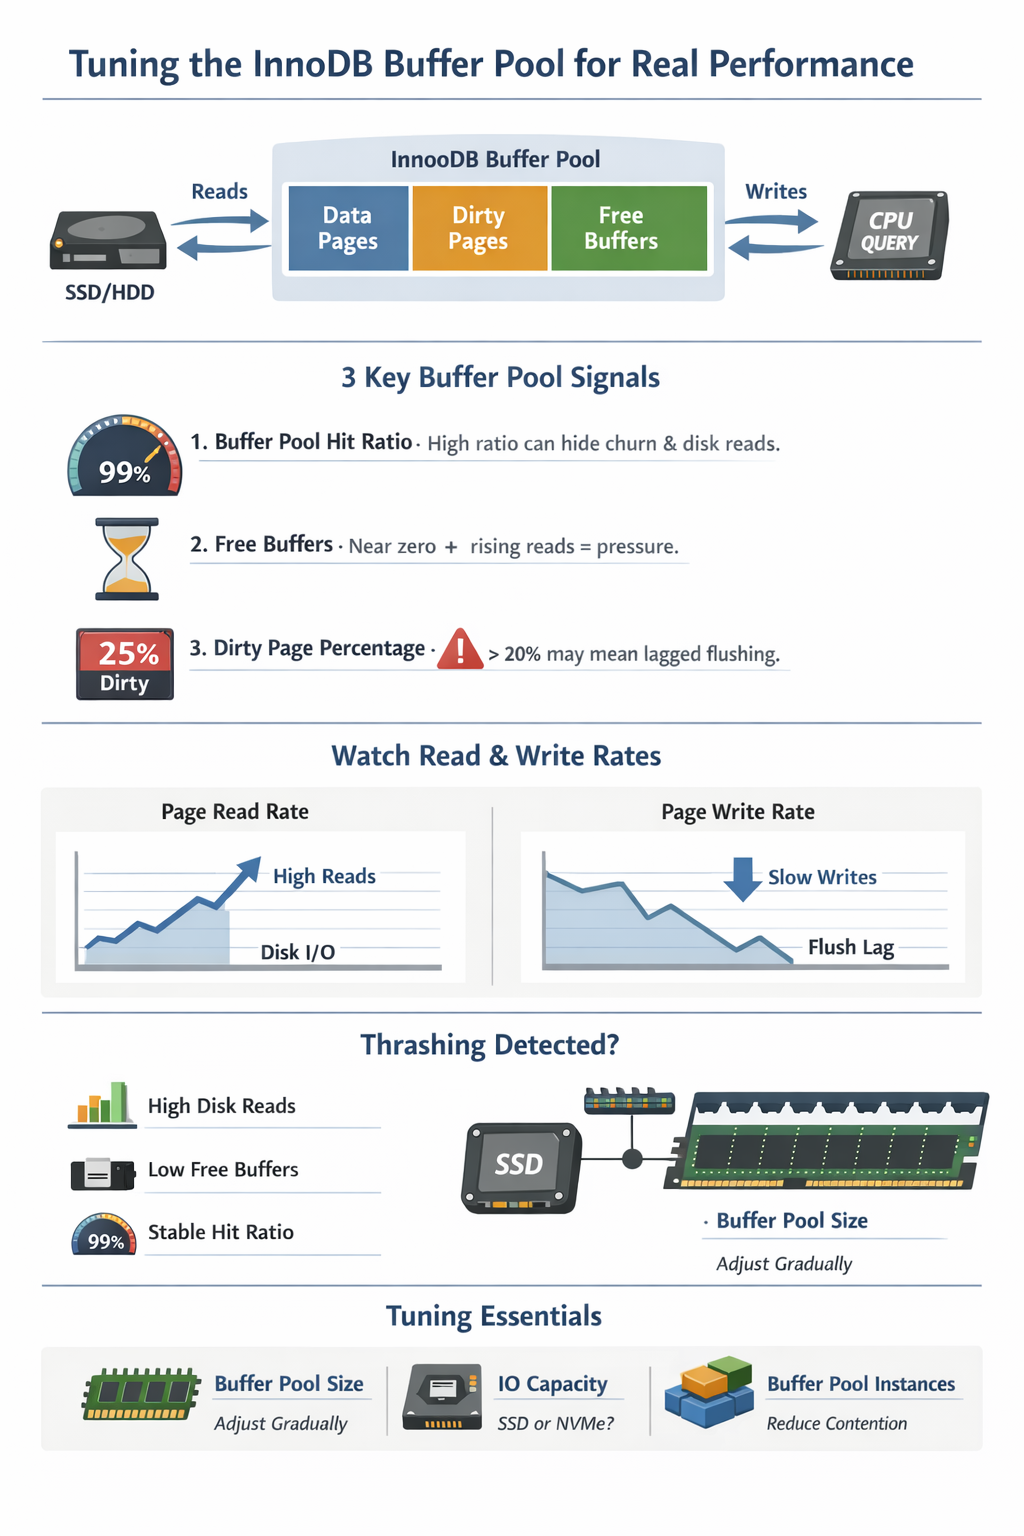
The InnoDB buffer pool is where database performance is quietly decided. It determines whether your workload hums along in memory or drags itself across disk. If you’re not actively observing and tuning it, you’re leaving performance on the table.
This guide walks through how to monitor, understand, and tune the buffer pool using real signals instead of guesswork.
What the Buffer Pool Really Is
The buffer pool isn’t just “memory for MySQL.” It’s a living system under constant pressure:
- A cache of data and indexes
- A write staging area (dirty pages)
- A contention zone between reads, writes, and eviction
Think of it as your database’s working memory. If your working set fits, queries glide. If it doesn’t, pages are constantly evicted and reloaded, introducing latency that rarely announces itself clearly.
A Simple Mental Model
            +---------------------------+
            |       Buffer Pool         |
            |---------------------------|
Reads  ---> |  Cached Pages             |
            |                           |
Writes ---> |  Dirty Pages (pending IO) |
            |                           |
Eviction -> |  LRU / Free List          |
            +---------------------------+
                      |
                      v
                   Disk (slow)
Three forces are always competing:
- Reads want hot data in memory
- Writes generate dirty pages
- Eviction makes room under pressure
Your job is to keep this system balanced.
How to Monitor the Buffer Pool
Option 1: Quick Snapshot
SHOW ENGINE INNODB STATUS\GUseful for human inspection. Look for:
- Buffer pool size
- Free buffers
- Database pages
- Modified (dirty) pages
- Page read/write rates
Great for debugging. Not ideal for automation.
Option 2: Structured Metrics (Recommended)
SELECT
    pool_id,
    free_buffers,
    database_pages,
    modified_database_pages
FROM information_schema.INNODB_BUFFER_POOL_STATS;
Key fields:
free_buffers→ Available pages (breathing room)database_pages→ Pages holding datamodified_database_pages→ Dirty pages waiting to flush
Great for automation.
The 5 Signals That Actually Matter
1. Buffer Pool Hit Ratio (Handle With Care)
Yes, it’s widely used. No, it’s not enough.
A high hit ratio does not mean your system is healthy. It does not capture:
- Page churn
- Eviction pressure
- Access patterns
You can have a 99% hit ratio and still be IO-bound.
Use it as a sanity check, not a decision-maker.
2. Free Buffers
SELECT SUM(free_buffers) AS free_buffers
FROM information_schema.INNODB_BUFFER_POOL_STATS;
Interpretation:
- Near zero during steady load → normal
- Near zero + rising disk reads → pressure
- Near zero while mostly idle → suspicious (possible misread or config issue)
3. Dirty Page Percentage
SELECT
    (SUM(modified_database_pages) / SUM(database_pages)) * 100.0 AS dirty_pct
FROM information_schema.INNODB_BUFFER_POOL_STATS;
Interpretation (context matters):
- 0–5% → Very clean
- 5–20% → Typical
- 20–30%+ → Potential flushing lag
4. Disk Read Pressure (Critical Signal)
SHOW GLOBAL STATUS LIKE 'Innodb_buffer_pool_reads';
-- Take two samples 60s apart and compare
Track the rate of change (reads/sec), not the absolute value.
Interpretation:
- Rising reads → Working set does not fit in memory
- Flat reads → Memory is absorbing the workload
5. Read Ahead / Eviction Pressure
SHOW GLOBAL STATUS LIKE 'Innodb_buffer_pool_read_ahead%';
SHOW GLOBAL STATUS LIKE 'Innodb_buffer_pool_pages_evicted';
SHOW GLOBAL STATUS LIKE 'Innodb_buffer_pool_reads';
Interpretation:
- Efficient read-ahead:
- read_ahead increases
- read_ahead_evicted remains low
- Inefficient read-ahead (wasted IO):
- High read_ahead_evicted / read_ahead
- Indicates access patterns defeating prefetching
- Buffer pool churn:
- pages_evicted rising
- buffer_pool_reads rising
- Indicates pages are evicted and re-read from disk
- Healthy vs unhealthy eviction:
- High evictions + stable reads → normal turnover
- High evictions + rising reads → memory pressure
Focus on rates of change over time, not absolute values.
Detecting Thrashing
Thrashing is when the buffer pool constantly evicts and reloads pages.
Classic Symptoms
- Low or zero free buffers
- Increasing disk reads
- Stable (but misleading) hit ratio
- Spiky query latency
Visualizing Thrash
Time --->

Memory:  [FULL][FULL][FULL][FULL]
Reads:   ↑   ↑↑   ↑↑↑  ↑↑↑↑
Latency:  -    ^    ^^   ^^^
Evictions: ↑   ↑↑   ↑↑↑  ↑↑↑↑
If you see this pattern, your working set does not fit in memory.
Tuning the Buffer Pool
Step 1: Size It Intentionally
Instead of blindly assigning 70% of RAM:
- Observe working set behavior
- Monitor free buffers and reads
- Increase gradually
Avoid starving the OS or filesystem cache.
Step 2: Tune Flushing Behavior
innodb_max_dirty_pages_pct = 75
innodb_io_capacity = 1000
innodb_io_capacity_max = 2000- Sustained IO spikes → increase innodb_io_capacity
- Dirty pages climbing → flushing lag
- Sudden stalls → checkpoint pressure
What they control:
innodb_io_capacity→ Expected steady-state IO throughputinnodb_io_capacity_max→ Burst flushing capacityinnodb_max_dirty_pages_pct→ Threshold for aggressive flushing
⚠️ These values should reflect real hardware capability.
Step 3: Buffer Pool Instances:Reduce Contention
A practical, battle-tested guideline:
Use 1 instance per ~1GB of buffer pool, up to a reasonable limit.
Buffer Pool Instances: Reducing Contention
The buffer pool can be split into multiple instances, each managing its own internal structures. This helps reduce contention under high concurrency.
Without this, all threads compete for the same buffer pool internals. With multiple instances, that load is distributed.
When It Matters
Buffer pool instances only help when contention exists. You’ll see benefits if your system has:
- High concurrency (many active threads)
- CPU-bound workloads
- Mutex contention in InnoDB
If your workload is primarily IO-bound, this setting will have little impact.
Sizing Guidelines
General guidance:
- < 1GB buffer pool → 1 instance
- 1GB–8GB → 2–4 instances
- 8GB–64GB → 4–8 instances
- 64GB+ → 8–16 instances
Keep Instances Large Enough
Each instance needs enough memory to function efficiently.
Avoid going below ~1GB per instance.
If instances are too small:
- LRU efficiency drops
- Eviction becomes more aggressive
- Cache locality suffers
Example
innodb_buffer_pool_size = 32G
innodb_buffer_pool_instances = 8
This gives ~4GB per instance, which is well-balanced.
Common Mistakes
- Increasing instances without evidence of contention
- Matching instance count to CPU cores
- Using many instances with a small buffer pool
- Expecting this to fix IO bottlenecks
Step 4: Understand Resizing Behavior
Buffer pool resizing is online in modern MySQL versions, but:
- It happens in chunks
- Controlled by
innodb_buffer_pool_chunk_size
Real-World Scenarios
Scenario 1: “Everything Looks Fine… But It’s Slow”
- High hit ratio
- Low free buffers
- Rising disk reads
Cause: Working set barely fits
Fix: Increase buffer pool size gradually
If increasing the buffer pool size does not reduce disk reads, the problem is not memory.
Scenario 2: Write-Heavy Workload
- Dirty pages increasing
- Periodic IO spikes
Cause: Flushing cannot keep up
Fix:
- Increase
innodb_io_capacity - Adjust dirty page thresholds
Scenario 3: Sudden Latency Spikes
- Sharp performance drops
- Disk activity surges
Cause: Checkpoint pressure
Fix:
- Improve IO capacity tuning
- Reduce dirty page buildup
Practical Monitoring Queries
Buffer Pool Usage (MB)
SELECT
    (SUM(database_pages) * 16) / 1024 AS mb_used
FROM information_schema.INNODB_BUFFER_POOL_STATS;
Assumes default 16KB page size (innodb_page_size).
Dirty Page Percentage
SELECT
    (modified_database_pages / database_pages) * 100 AS dirty_pct
FROM information_schema.INNODB_BUFFER_POOL_STATS;
Free Buffer Check
SELECT SUM(free_buffers) AS free_buffers
FROM information_schema.INNODB_BUFFER_POOL_STATS;
Common Mistakes
- Treating 70% as a rule instead of a starting point
- Blindly trusting hit ratio
- Ignoring disk read trends
- Oversizing and starving the OS
- Not tuning IO capacity
- Leaving defaults in write-heavy systems
Quick Checklist
If you remember nothing else:
- Reads increasing? → working set too big
- Free buffers always ~0? → pressure
- Dirty pages high? → flushing lag
- Latency spiking? → checkpoint or IO saturation
Final Thoughts
The InnoDB buffer pool doesn’t fail loudly. It degrades quietly until your disk becomes the bottleneck.
By the time you notice, you’re debugging latency instead of preventing it.
Monitor the right signals, and you’ll see problems forming before users do.
That’s the difference between reacting to performance… and controlling it. ∎


Discussion
We invite you to our forum for discussion. You are welcome to use the widget below.