%22%3E%3Cpath%20d=%22M352.016%20109.322h-18.62v33.317H308.887V31.542h45.54c26.587.0%2042.669%2015.7006%2042.669%2038.4065V70.2514c0%2025.715-20.051%2039.0416-45.051%2039.0416L352.016%20109.322v0zm20.207-38.885C372.223%2059.4847%20364.589%2053.6128%20352.32%2053.6128H333.367V87.5641H352.78c12.27.0%2019.414-7.3081%2019.414-16.8242V70.437H372.223z%22%20fill=%22%23fff%22/%3E%3Cpath%20d=%22M410.776%20142.648V31.542H494.84V53.3001H435.139V75.8497h52.527V97.6078H435.139V120.949h60.494v21.758H410.776V142.648v0z%22%20fill=%22%23fff%22/%3E%3Cpath%20d=%22M582.46%20142.648%20558.588%20107.104H539.331v35.544H514.822V31.542h50.939c26.284.0%2042.032%2013.815%2042.032%2036.6674V68.5123c0%2017.9282-9.702%2029.2128-23.872%2034.4497L611.145%20142.639H582.451L582.46%20142.648zM582.95%2069.4893C582.95%2059.0255%20575.62%2053.603%20563.694%2053.603H539.341V85.5026h24.843C576.12%2085.5026%20582.95%2079.1422%20582.95%2069.8019V69.4991%2069.4893z%22%20fill=%22%23fff%22/%3E%3Cpath%20d=%22M678.058%20145.618c-33.221.0-57.907-25.568-57.907-57.9171V87.3882C620.151%2055.3812%20644.337%2029.1678%20679.048%2029.1678c21.285.0%2034.055%207.0639%2044.54%2017.3616L707.781%2064.6922C699.059%2056.7979%20690.21%2051.9909%20678.891%2051.9909c-19.021.0-32.761%2015.7593-32.761%2035.0652V87.3687c0%2019.3063%2013.397%2035.3683%2032.761%2035.3683C691.788%20122.737%20699.706%20117.588%20708.585%20109.537l15.807%2015.916C712.76%20137.851%20699.863%20145.56%20678.088%20145.56L678.058%20145.618z%22%20fill=%22%23fff%22/%3E%3Cpath%20d=%22M789.963%20145.618c-34.858.0-59.858-25.9-59.858-57.9171V87.3882c0-32.007%2025.333-58.2204%2060.162-58.2204%2034.829.0%2059.858%2025.9007%2059.858%2057.9176V87.398c0%2032.007-25.333%2058.22-60.162%2058.22zm34.212-58.22C824.175%2068.0922%20809.975%2052.03%20789.963%2052.03%20769.952%2052.03%20756.095%2067.7893%20756.095%2087.0951V87.4078C756.095%20106.714%20770.295%20122.776%20790.306%20122.776%20810.318%20122.776%20824.175%20107.017%20824.175%2087.7107V87.398v0z%22%20fill=%22%23fff%22/%3E%3Cpath%20d=%22M985.089%20142.736%201039.93%2029.1678%201094.77%20142.746h-27.5L1039.93%2086.2256l-27.24%2056.5204H985.089V142.736z%22%20fill=%22%23fff%22/%3E%3Cpath%20d=%22M974.936%2031.5811V145.628L891.304%2078.0968V142.551H865.285V29.1678L948.917%2096.4354V31.5811h26.019z%22%20fill=%22%23fff%22/%3E%3C/g%3E%3Cpath%20d=%22M219.315%20146.829c28.718-18.788%2038.114-57.1102%2020.735-87.2301-8.708-15.108-22.784-25.9277-39.624-30.4456-15.602-4.1923-31.898-2.478-46.241%204.7743L134.603.0%2093.9541%2070.4613.0%20233.311H269.206l-49.891-86.482zM195.821%2046.4134c12.241%203.263%2022.427%2011.1294%2028.771%2022.0826%2012.47%2021.5912%205.993%2048.977-14.23%2062.808L163.128%2049.4361c10.176-4.8971%2021.653-5.9652%2032.693-3.0227zM134.603%2035.7593%20238.247%20215.426H177.605L104.268%2088.3409l30.329-52.5762L134.603%2035.7593zM30.9588%20215.426l62.99-109.168L156.939%20215.426H30.9588z%22%20fill=%22url(%23paint0_linear_1391_11470)%22/%3E%3Cpath%20d=%22M306.655%20202.335C306.655%20196.555%20307.958%20191.37%20310.565%20186.78%20313.172%20182.133%20316.713%20178.507%20321.19%20175.9%20325.723%20173.293%20330.738%20171.99%20336.235%20171.99%20342.695%20171.99%20348.333%20173.548%20353.15%20176.665%20357.967%20179.782%20361.48%20184.202%20363.69%20189.925H354.425C352.782%20186.355%20350.402%20183.607%20347.285%20181.68%20344.225%20179.753%20340.542%20178.79%20336.235%20178.79%20332.098%20178.79%20328.387%20179.753%20325.1%20181.68%20321.813%20183.607%20319.235%20186.355%20317.365%20189.925%20315.495%20193.438%20314.56%20197.575%20314.56%20202.335%20314.56%20207.038%20315.495%20211.175%20317.365%20214.745%20319.235%20218.258%20321.813%20220.978%20325.1%20222.905%20328.387%20224.832%20332.098%20225.795%20336.235%20225.795%20340.542%20225.795%20344.225%20224.86%20347.285%20222.99%20350.402%20221.063%20352.782%20218.315%20354.425%20214.745H363.69C361.48%20220.412%20357.967%20224.803%20353.15%20227.92%20348.333%20230.98%20342.695%20232.51%20336.235%20232.51%20330.738%20232.51%20325.723%20231.235%20321.19%20228.685%20316.713%20226.078%20313.172%20222.48%20310.565%20217.89%20307.958%20213.3%20306.655%20208.115%20306.655%20202.335zm130.259%2030.26C431.418%20232.595%20426.403%20231.32%20421.869%20228.77%20417.336%20226.163%20413.738%20222.565%20411.074%20217.975%20408.468%20213.328%20407.164%20208.115%20407.164%20202.335S408.468%20191.37%20411.074%20186.78C413.738%20182.133%20417.336%20178.535%20421.869%20175.985%20426.403%20173.378%20431.418%20172.075%20436.914%20172.075%20442.468%20172.075%20447.511%20173.378%20452.044%20175.985%20456.578%20178.535%20460.148%20182.105%20462.754%20186.695%20465.361%20191.285%20466.664%20196.498%20466.664%20202.335%20466.664%20208.172%20465.361%20213.385%20462.754%20217.975%20460.148%20222.565%20456.578%20226.163%20452.044%20228.77%20447.511%20231.32%20442.468%20232.595%20436.914%20232.595zm0-6.715C441.051%20225.88%20444.763%20224.917%20448.049%20222.99%20451.393%20221.063%20453.999%20218.315%20455.869%20214.745%20457.796%20211.175%20458.759%20207.038%20458.759%20202.335%20458.759%20197.575%20457.796%20193.438%20455.869%20189.925%20453.999%20186.355%20451.421%20183.607%20448.134%20181.68%20444.848%20179.753%20441.108%20178.79%20436.914%20178.79%20432.721%20178.79%20428.981%20179.753%20425.694%20181.68%20422.408%20183.607%20419.801%20186.355%20417.874%20189.925%20416.004%20193.438%20415.069%20197.575%20415.069%20202.335%20415.069%20207.038%20416.004%20211.175%20417.874%20214.745%20419.801%20218.315%20422.408%20221.063%20425.694%20222.99%20429.038%20224.917%20432.778%20225.88%20436.914%20225.88zm134.906-52.7V232H564.085V188.14L544.535%20232H539.095L519.46%20188.055V232H511.725V173.18H520.055L541.815%20221.8l21.76-48.62H571.82zm108.063.0V232H672.148V188.14L652.598%20232H647.158l-19.635-43.945V232H619.788V173.18H628.118l21.76%2048.62%2021.76-48.62H679.883zM735.416%20172.755V210.24C735.416%20215.51%20736.691%20219.42%20739.241%20221.97%20741.848%20224.52%20745.446%20225.795%20750.036%20225.795%20754.57%20225.795%20758.111%20224.52%20760.661%20221.97%20763.268%20219.42%20764.571%20215.51%20764.571%20210.24V172.755H772.306v37.4C772.306%20215.085%20771.315%20219.25%20769.331%20222.65%20767.348%20225.993%20764.656%20228.487%20761.256%20230.13%20757.913%20231.773%20754.145%20232.595%20749.951%20232.595%20745.758%20232.595%20741.961%20231.773%20738.561%20230.13%20735.218%20228.487%20732.555%20225.993%20730.571%20222.65%20728.645%20219.25%20727.681%20215.085%20727.681%20210.155v-37.4H735.416zM866.64%20232H858.905l-31.11-47.175V232H820.06V172.67H827.795l31.11%2047.09V172.67H866.64V232zm55.77-59.245V232H914.675V172.755H922.41zm84.5.0V179.045H990.758V232H983.023V179.045H966.788V172.755h40.122zm85.85.0-19.3%2036.89V232H1065.73V209.645L1046.35%20172.755H1054.93L1069.55%20202.76%201084.17%20172.755H1092.76z%22%20fill=%22%23fff%22/%3E%3Cdefs%3E%3ClinearGradient%20id=%22paint0_linear_1391_11470%22%20x1=%2230.363%22%20y1=%22238.463%22%20x2=%22230.327%22%20y2=%2238.6685%22%20gradientUnits=%22userSpaceOnUse%22%3E%3Cstop%20stop-color=%22%23FC3519%22/%3E%3Cstop%20offset=%221%22%20stop-color=%22%23F0D136%22/%3E%3C/linearGradient%3E%3CclipPath%20id=%22clip0_1391_11470%22%3E%3Crect%20width=%22962.614%22%20height=%22116.656%22%20fill=%22%23fff%22%20transform=%22translate(132.155%2028.9724)%22/%3E%3C/clipPath%3E%3C/defs%3E%3C/svg%3E)
Our PostgreSQL cluster is running, and the demo app is generating traffic — but we have no visibility into the health of the Kubernetes cluster, services, or applications.
What happens when disk space runs out? What if the database is under heavy load and needs scaling? What if errors are buried in application logs? How busy are the network and storage layers? What’s the actual cost of the infrastructure?
This is where Coroot comes in.
Coroot is an open-source observability platform that provides dashboards for profiling, logs, service maps, and resource usage — helping you track system health and diagnose issues quickly.
We’ll deploy it using Helm via ArgoCD, continuing with our GitOps workflow.
This is Part 4 in our series. Previously, we:
Set up ArgoCD and a GitHub repository for declarative manifests (Part 1)
Installed a PostgreSQL cluster using Percona Operator
Deployed a demo application to simulate traffic and interact with the database
All infrastructure is defined declaratively and deployed from the GitHub repository, following GitOps practices.
So far, we’ve explored cluster scaling, user management, and dynamic configuration — and now it’s time for observability.
We’ll install Coroot by following the official documentation for Kubernetes.
Steps ahead:
Install the Coroot Operator
Install the Coroot Community Edition
Let’s get started.
Project Structure
We already have a postgres/ directory for PostgreSQL manifests and an apps/ directory for ArgoCD applications.
We’ll preserve this layout and add a new coroot/ folder for clarity. You can use a different structure if preferred.
Create Manifest for Installing the Coroot Operator
The documentation recommends installing via Helm.
Since we use ArgoCD, we’ll create a manifest that installs via Helm.
Create file: coroot/operator.yaml
apiVersion: argoproj.io/v1alpha1
kind: Application
metadata:
  name: coroot-operator
  namespace: argocd
spec:
  project: default
  source:
    repoURL: https://coroot.github.io/helm-charts
    chart: coroot-operator
    targetRevision: 0.4.2
  destination:
    server: https://kubernetes.default.svc
    namespace: coroot
  syncPolicy:
    automated:
      prune: true
      selfHeal: true
    syncOptions:
      - CreateNamespace=true
Note: I’m using version 0.4.2, which was current at the time of writing.
To check available versions, use this GitHub link or Helm CLI:
helm repo add coroot https://coroot.github.io/helm-charts
helm repo update
helm search repo coroot-operator --versions
Create Manifest for Installing Coroot Community Edition
Create file: coroot/coroot.yaml
apiVersion: argoproj.io/v1alpha1
kind: Application
metadata:
  name: coroot
  namespace: argocd
spec:
  project: default
  source:
    repoURL: https://coroot.github.io/helm-charts
    chart: coroot-ce
    targetRevision: 0.3.1
    helm:
      parameters:
        - name: clickhouse.shards
          value: "2"
        - name: clickhouse.replicas
          value: "2"
        - name: service.type
          value: LoadBalancer
  destination:
    server: https://kubernetes.default.svc
    namespace: coroot
  syncPolicy:
    automated:
      prune: true
      selfHeal: true
This chart creates a minimal Coroot Custom Resource.
I’ve added service.type: LoadBalancer to expose a public IP.
If you don’t use LoadBalancer, you’ll need to forward the Coroot port after installation:
kubectl port-forward -n coroot service/coroot-coroot 8080:8080Create ArgoCD Application Manifest
Since we manage our infrastructure via a GitHub repository, we need an ArgoCD Application that tracks changes in the coroot/ folder.
Create file: apps/argocd-coroot.yaml
apiVersion: argoproj.io/v1alpha1
kind: Application
metadata:
  name: coroot-sync-app
  namespace: argocd
spec:
  project: default
  source:
    repoURL: https://github.com/dbazhenov/percona-argocd-pg-coroot.git
    targetRevision: main
    path: coroot
  destination:
    server: https://kubernetes.default.svc
    namespace: coroot
  syncPolicy:
    automated:
      prune: true
      selfHeal: true
    syncOptions:
      - CreateNamespace=true
This lightweight app will monitor the folder and apply updates automatically if a change is detected (e.g. chart version bump).
Define Chart Installation Order
We have two charts: operator.yaml and coroot.yaml, and the operator must be installed first.
Create coroot/kustomization.yaml to specify resource order:
apiVersion: kustomize.config.k8s.io/v1beta1
kind: Kustomization
resources:
  - operator.yaml
  - coroot.yaml
Publish Manifests to GitHub
Check which files were changed:
git statusAdd changes:
git add .Verify staged files:
git statusCommit:
git commit -m "Installing Coroot Operator and Coroot with ArgoCD"Push:
git push origin mainApply ArgoCD Application
Deploy the ArgoCD app that installs Coroot from our GitHub repository:
kubectl apply -f apps/argocd-coroot.yaml -n argocdValidate installation and sync:
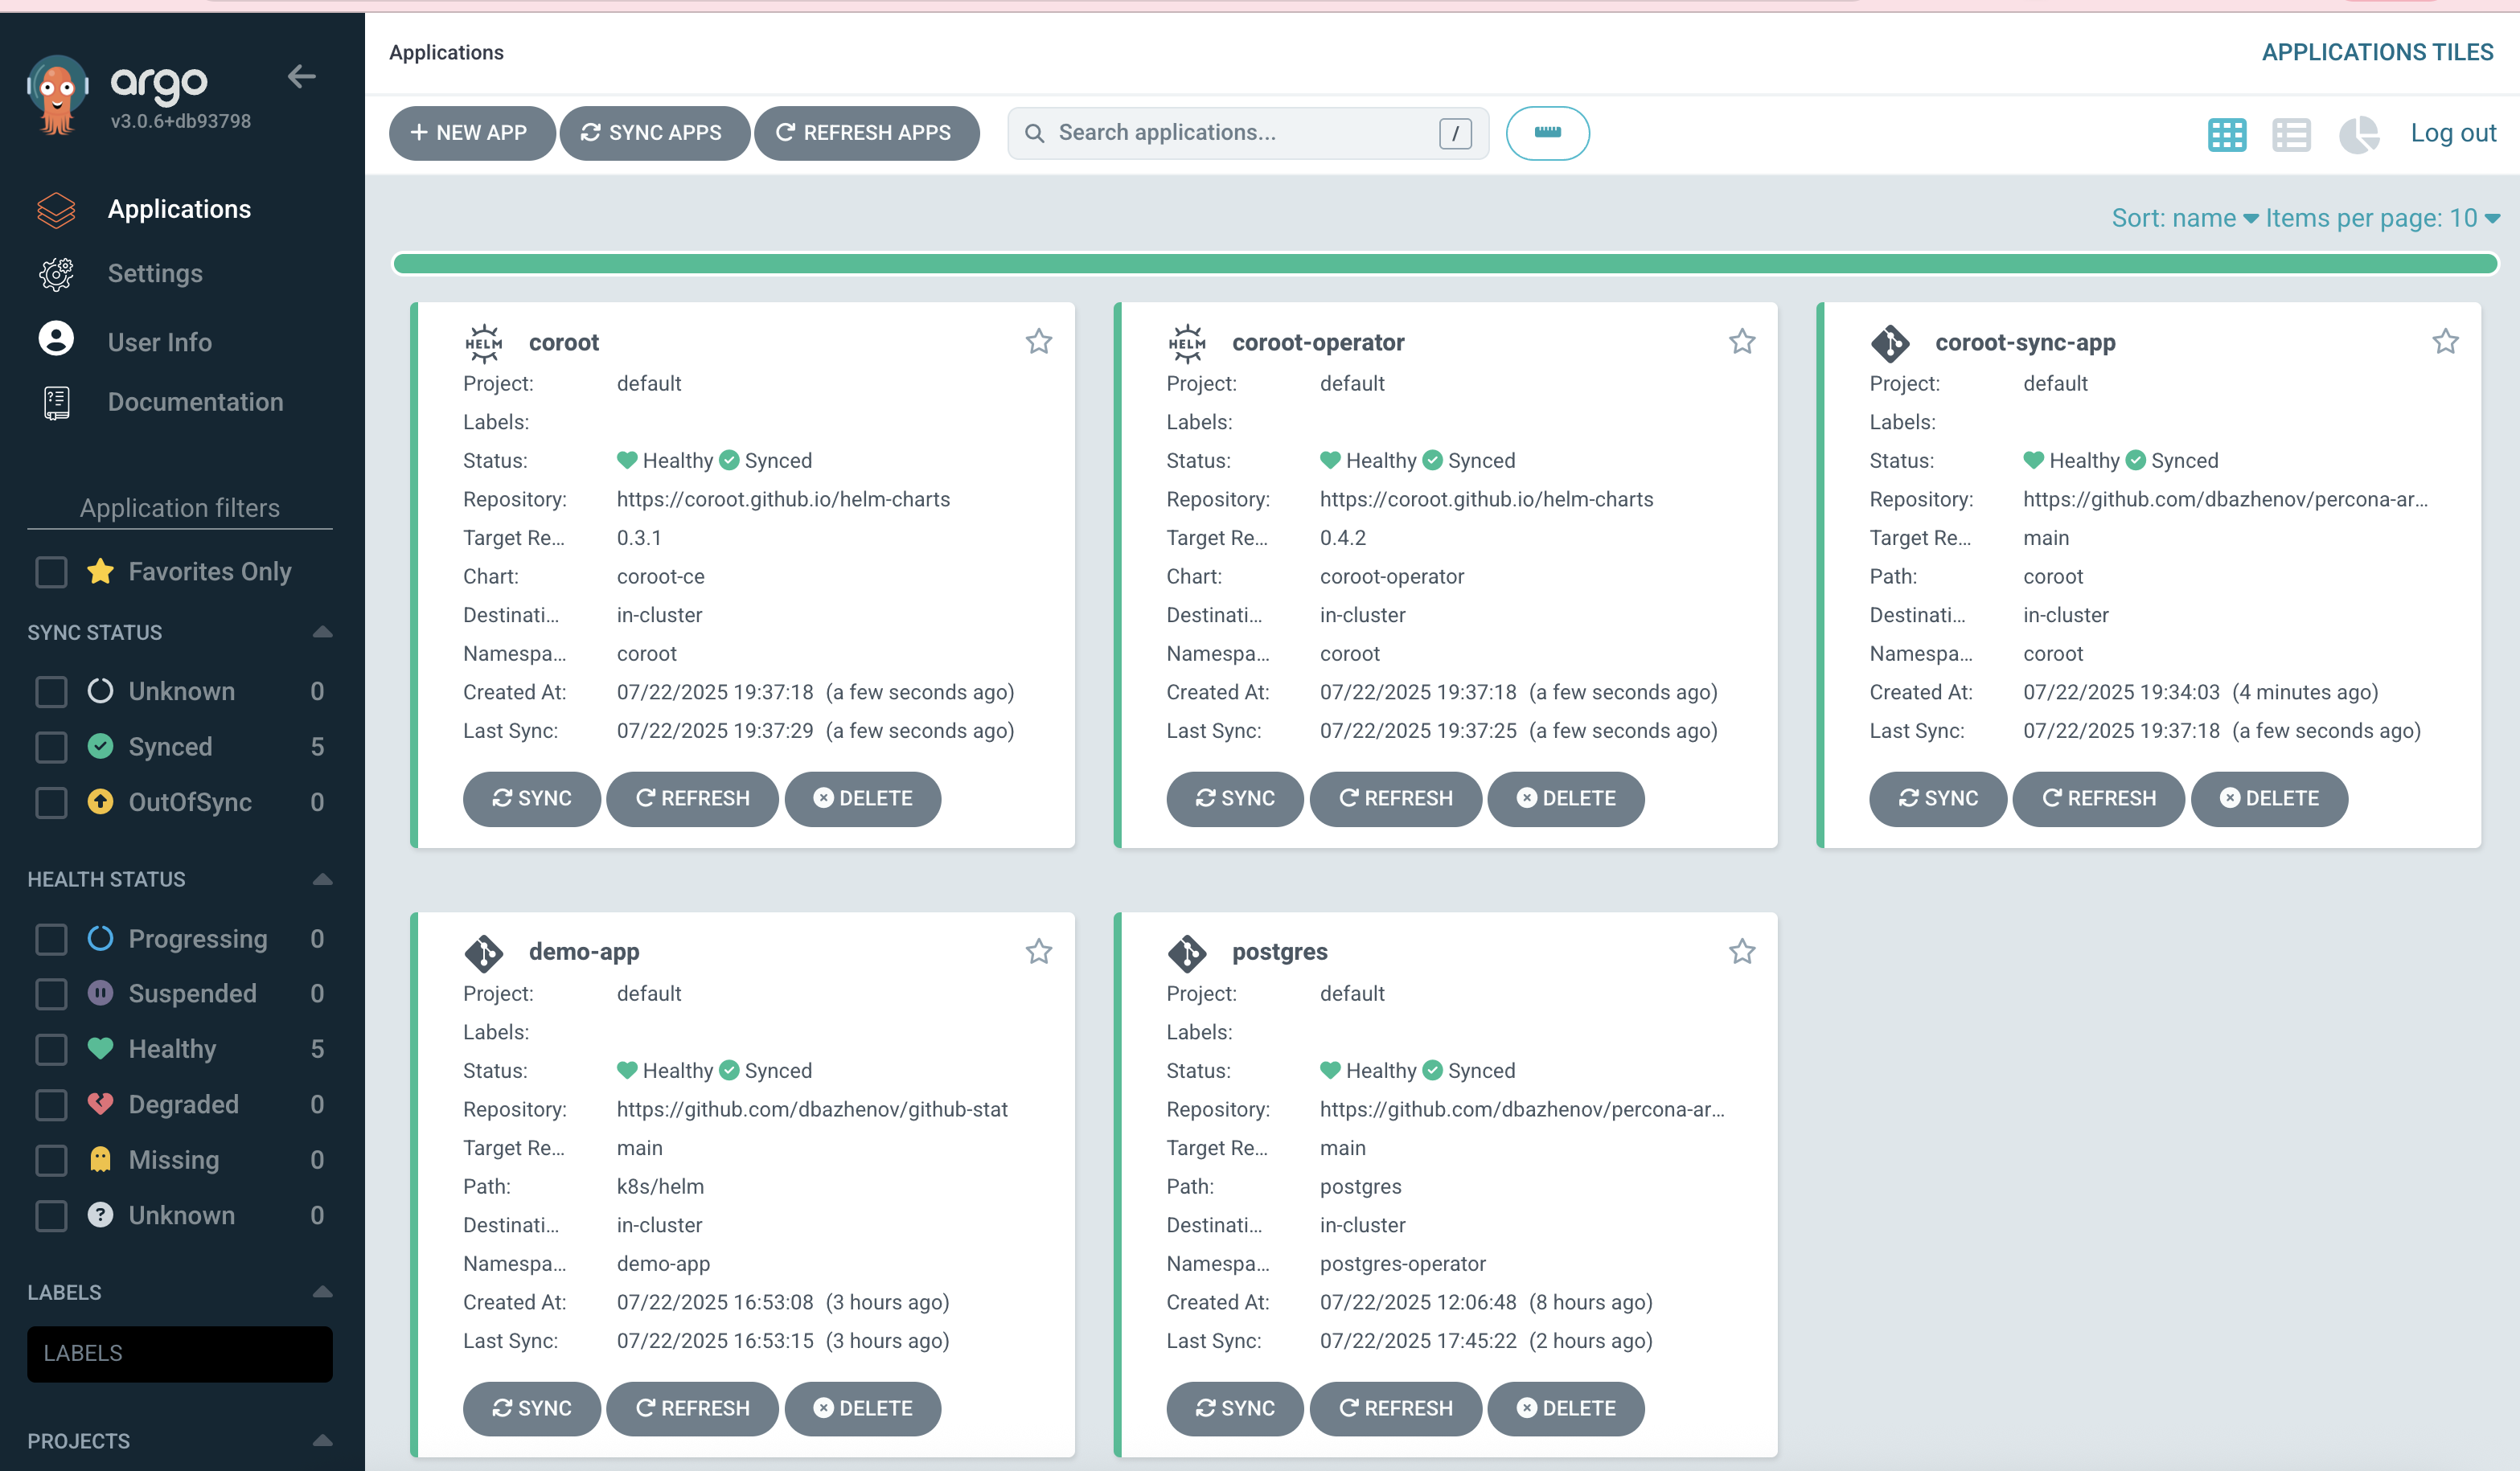
We now see coroot, coroot-operator, and coroot-sync-app deployed.
Access Coroot UI
Since we deployed Coroot using LoadBalancer, retrieve its external IP:
kubectl get svc -n corootOpen EXTERNAL-IP on port 8080.
For example: http://35.202.140.216:8080/
If you didn’t use LoadBalancer, run port-forward:
kubectl port-forward -n coroot service/coroot-coroot 8080:8080Then visit http://localhost:8080
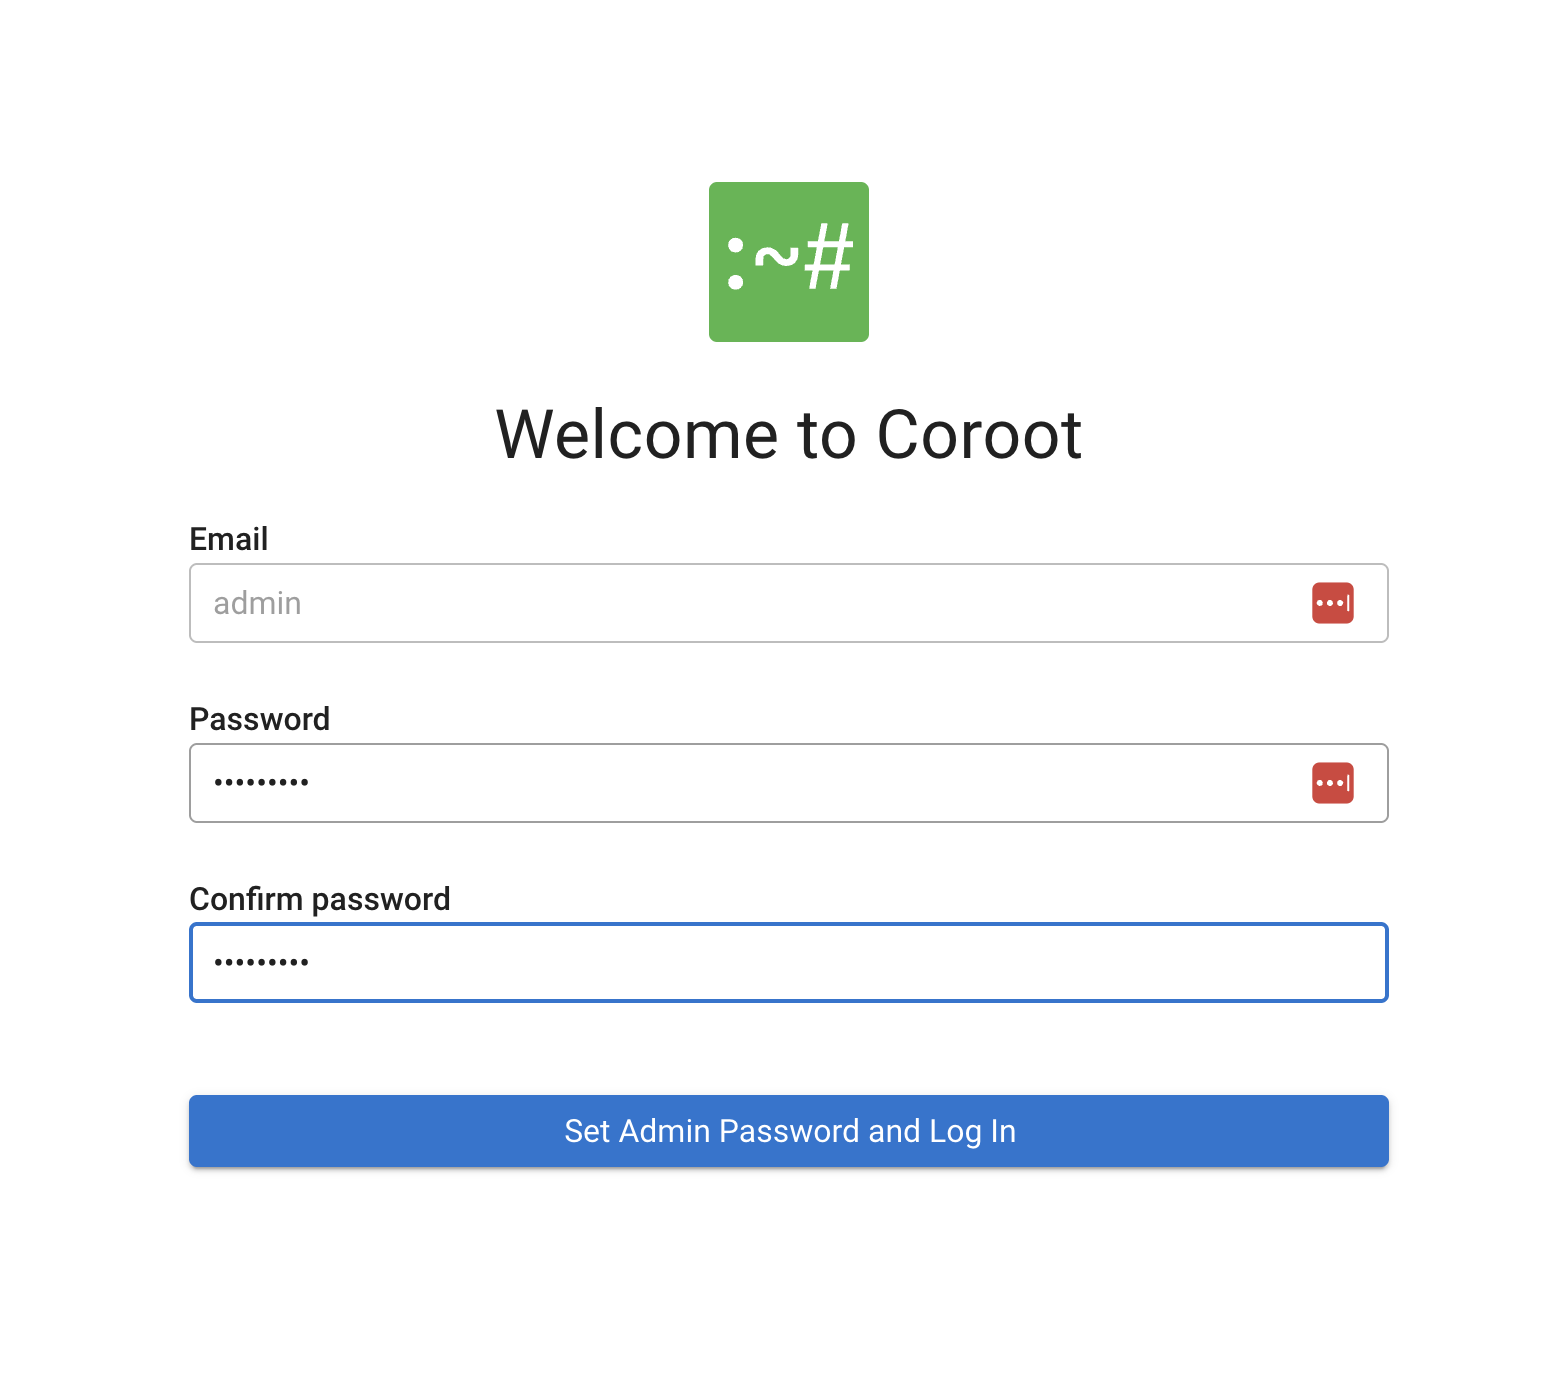
You’ll be prompted to set an admin password on first login.
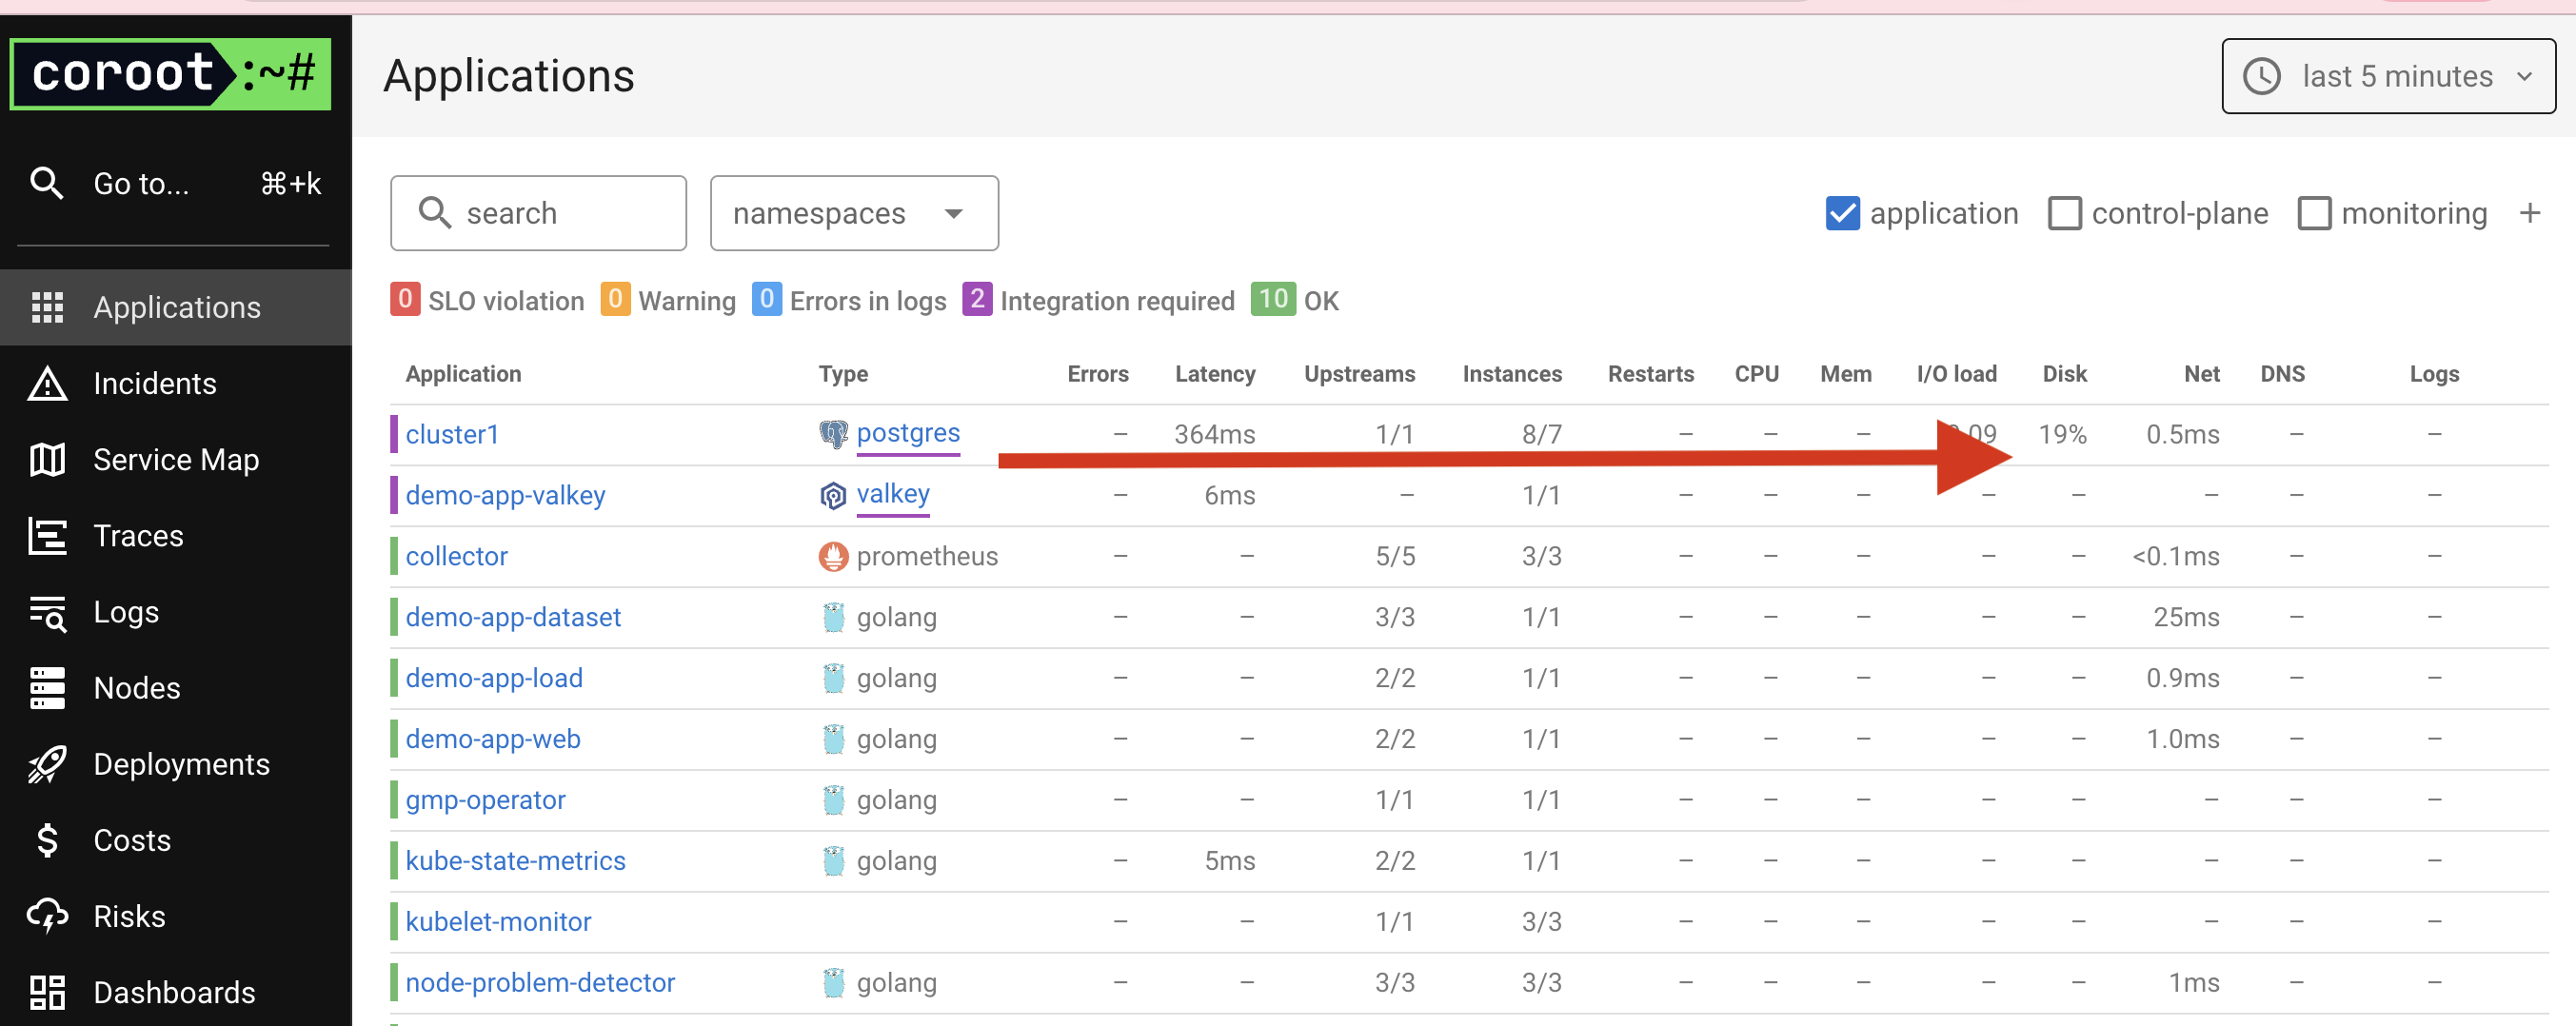
Exploring Coroot UI
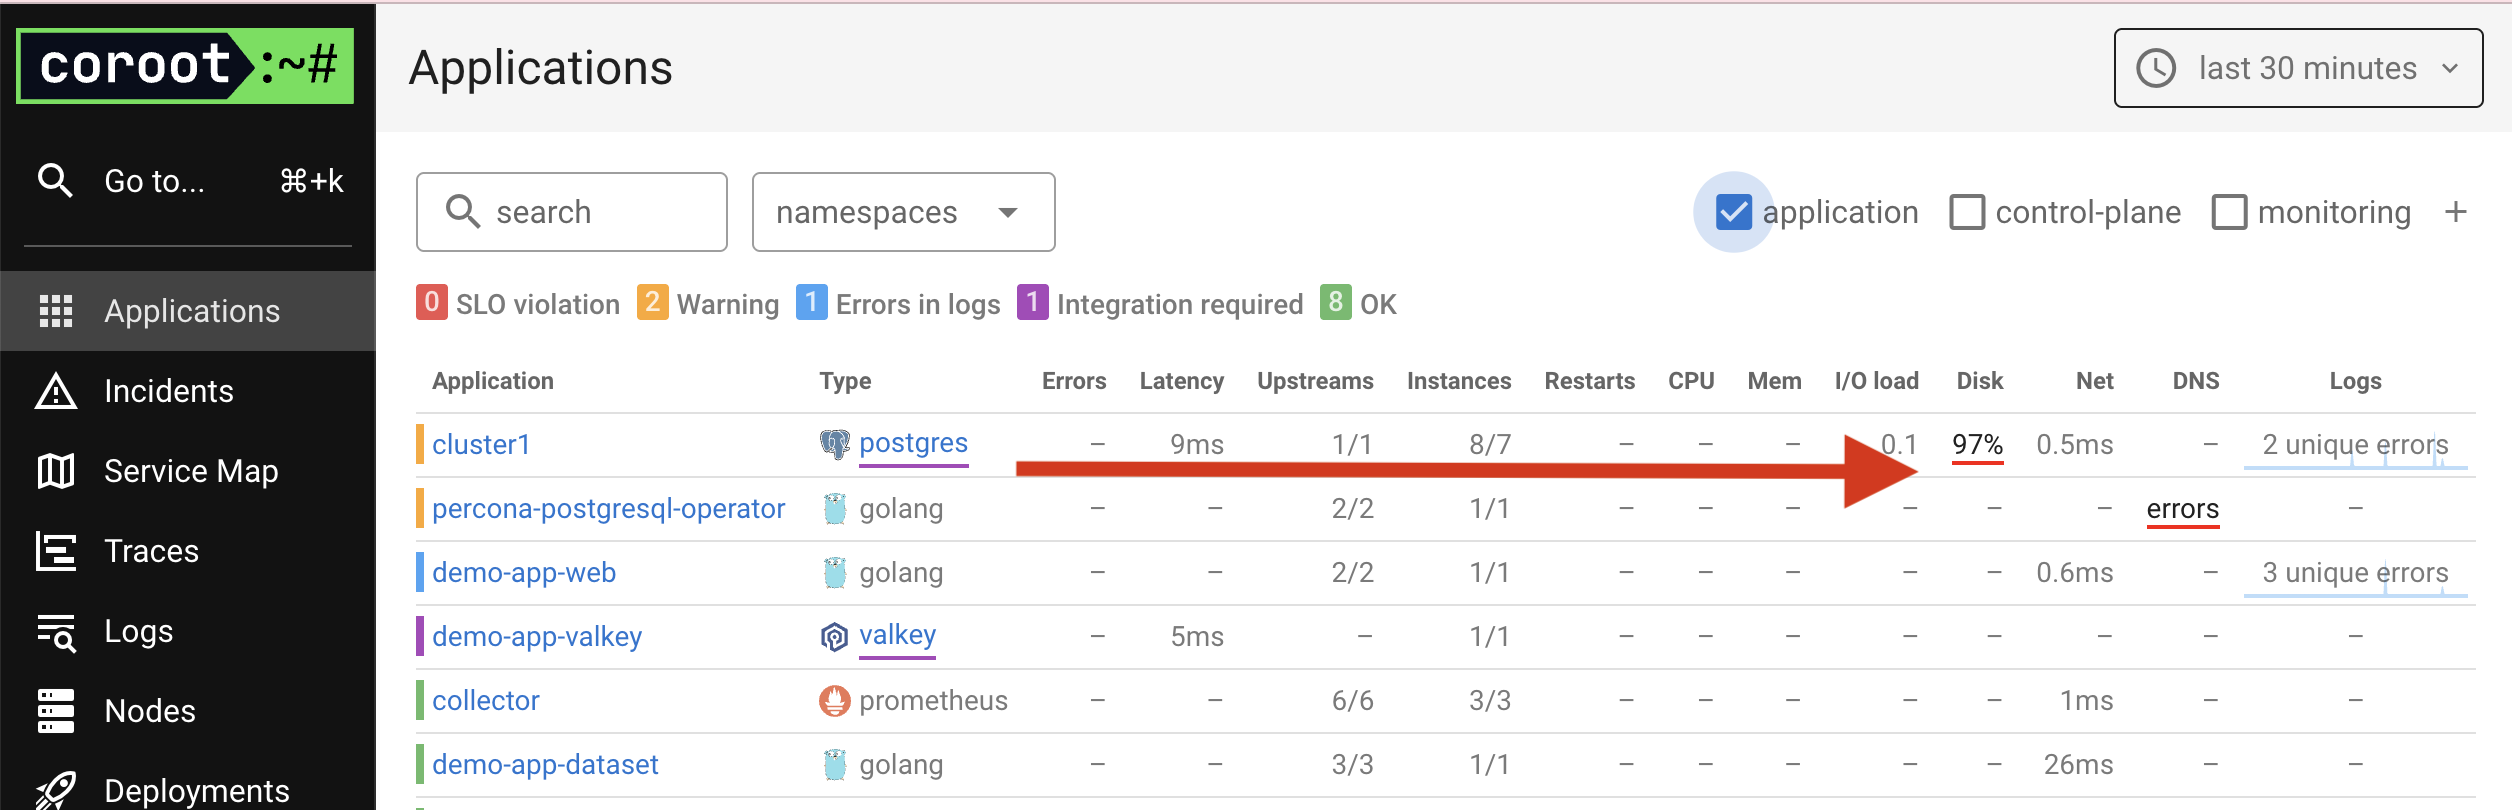
On the home page, we see a list of applications running in the cluster and resource usage.
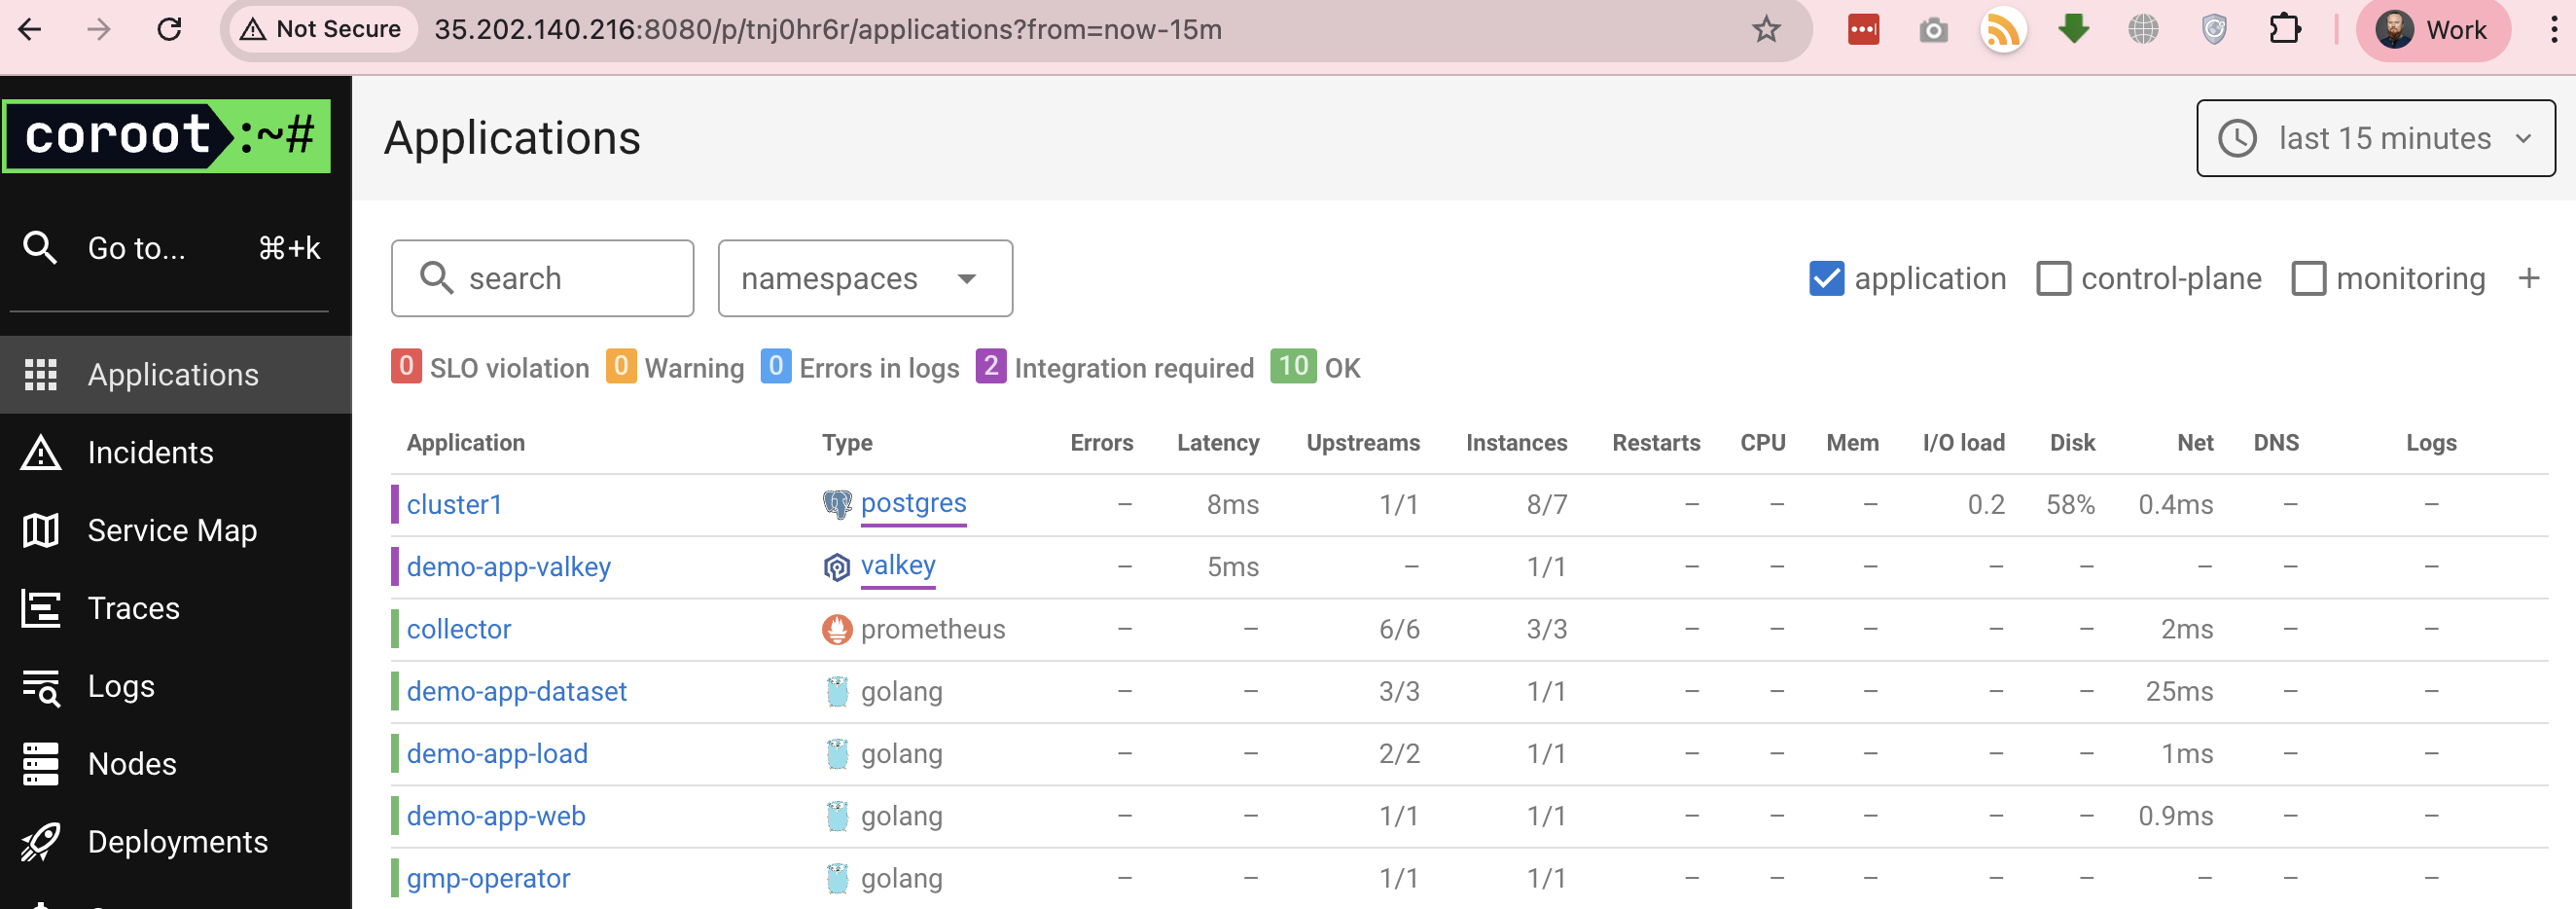
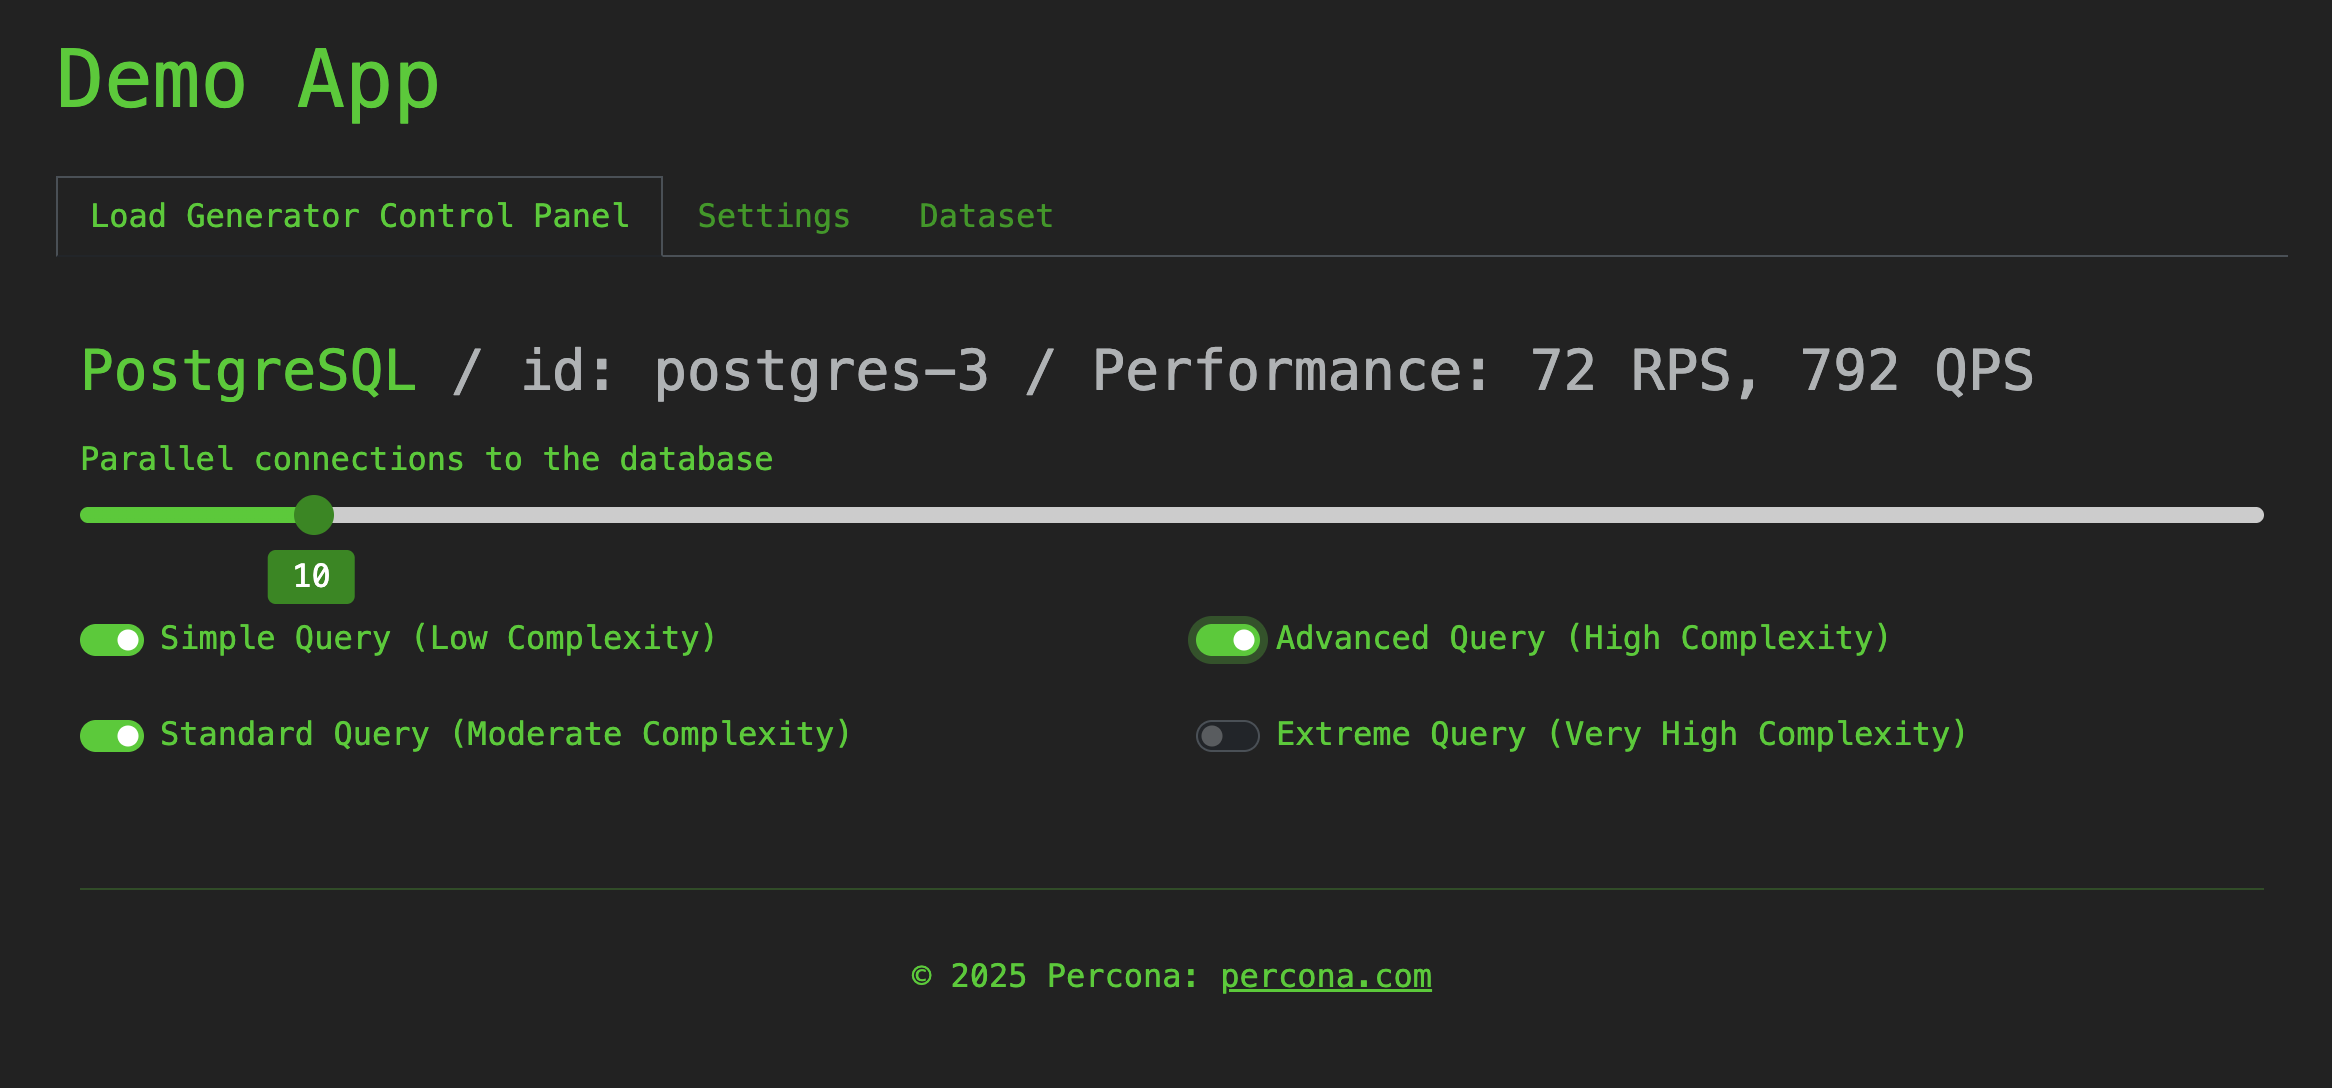
I increased the load on the PostgreSQL cluster using the Demo App to test observability.
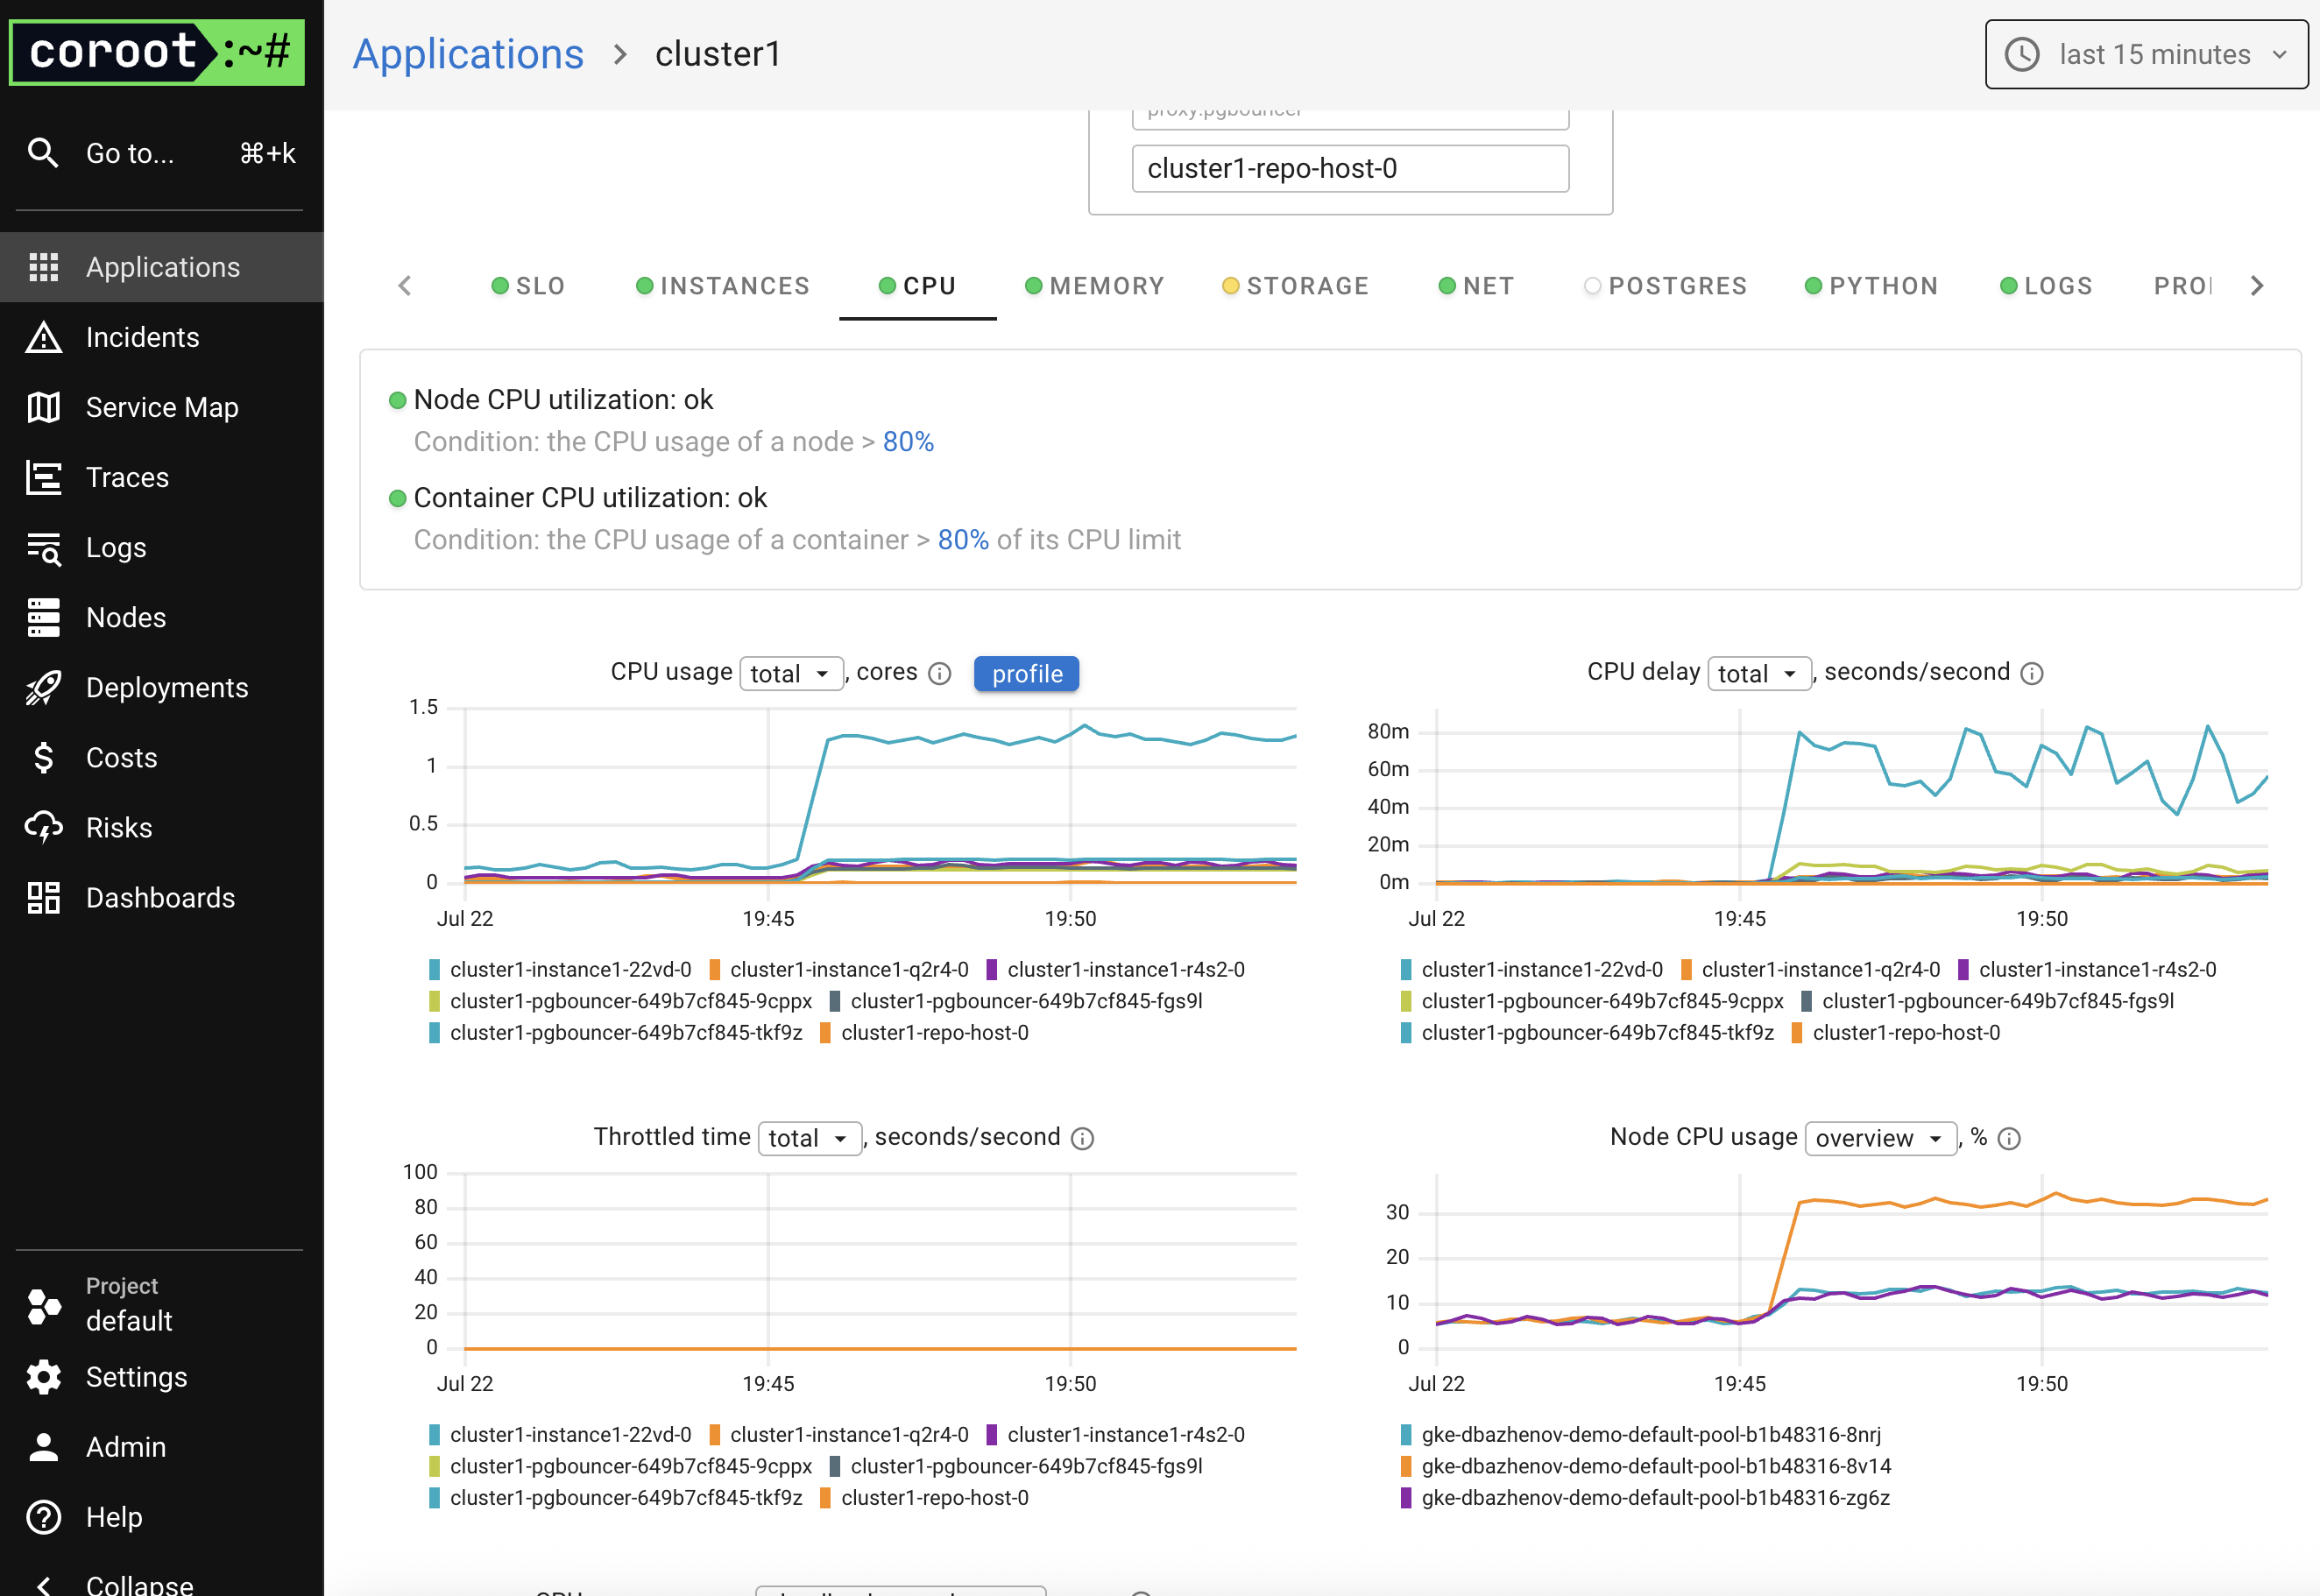
The PostgreSQL cluster dashboard offers several tabs:
- CPU
- Memory
- Storage
- Instances
- Logs
- Profiling
- Tracing
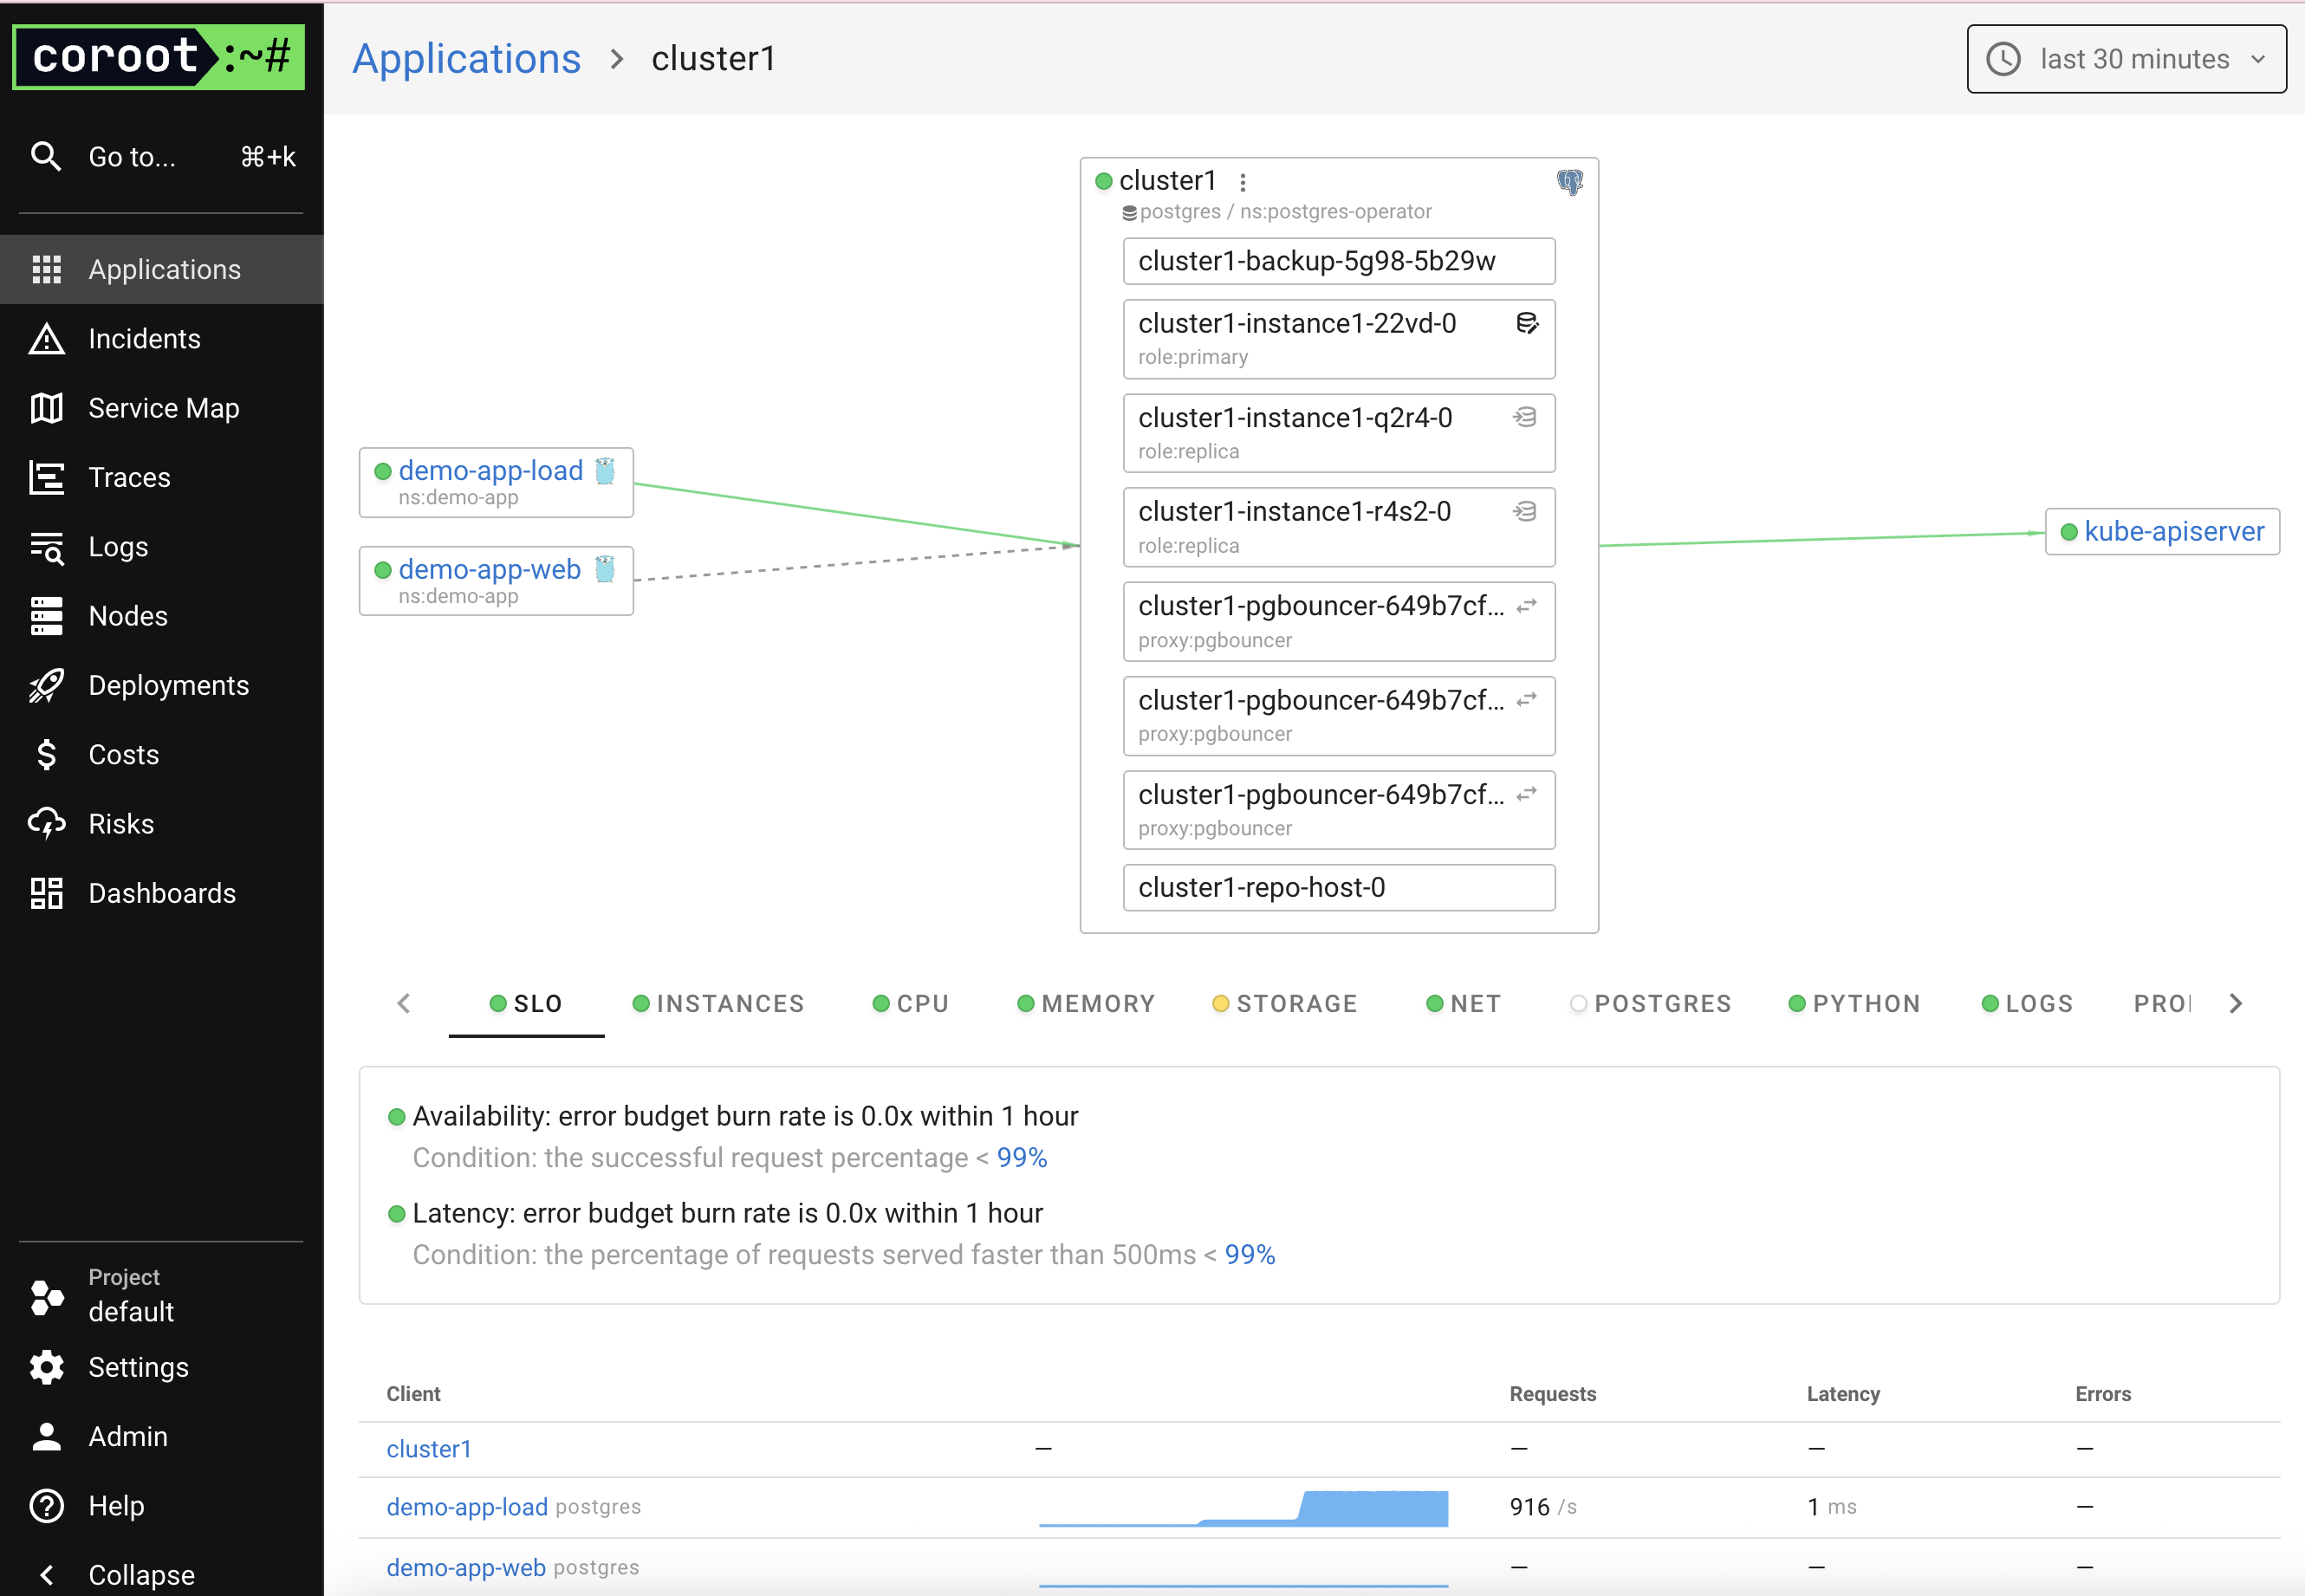
Coroot displays a visual map of service interactions — showing which app connects to the PostgreSQL cluster.
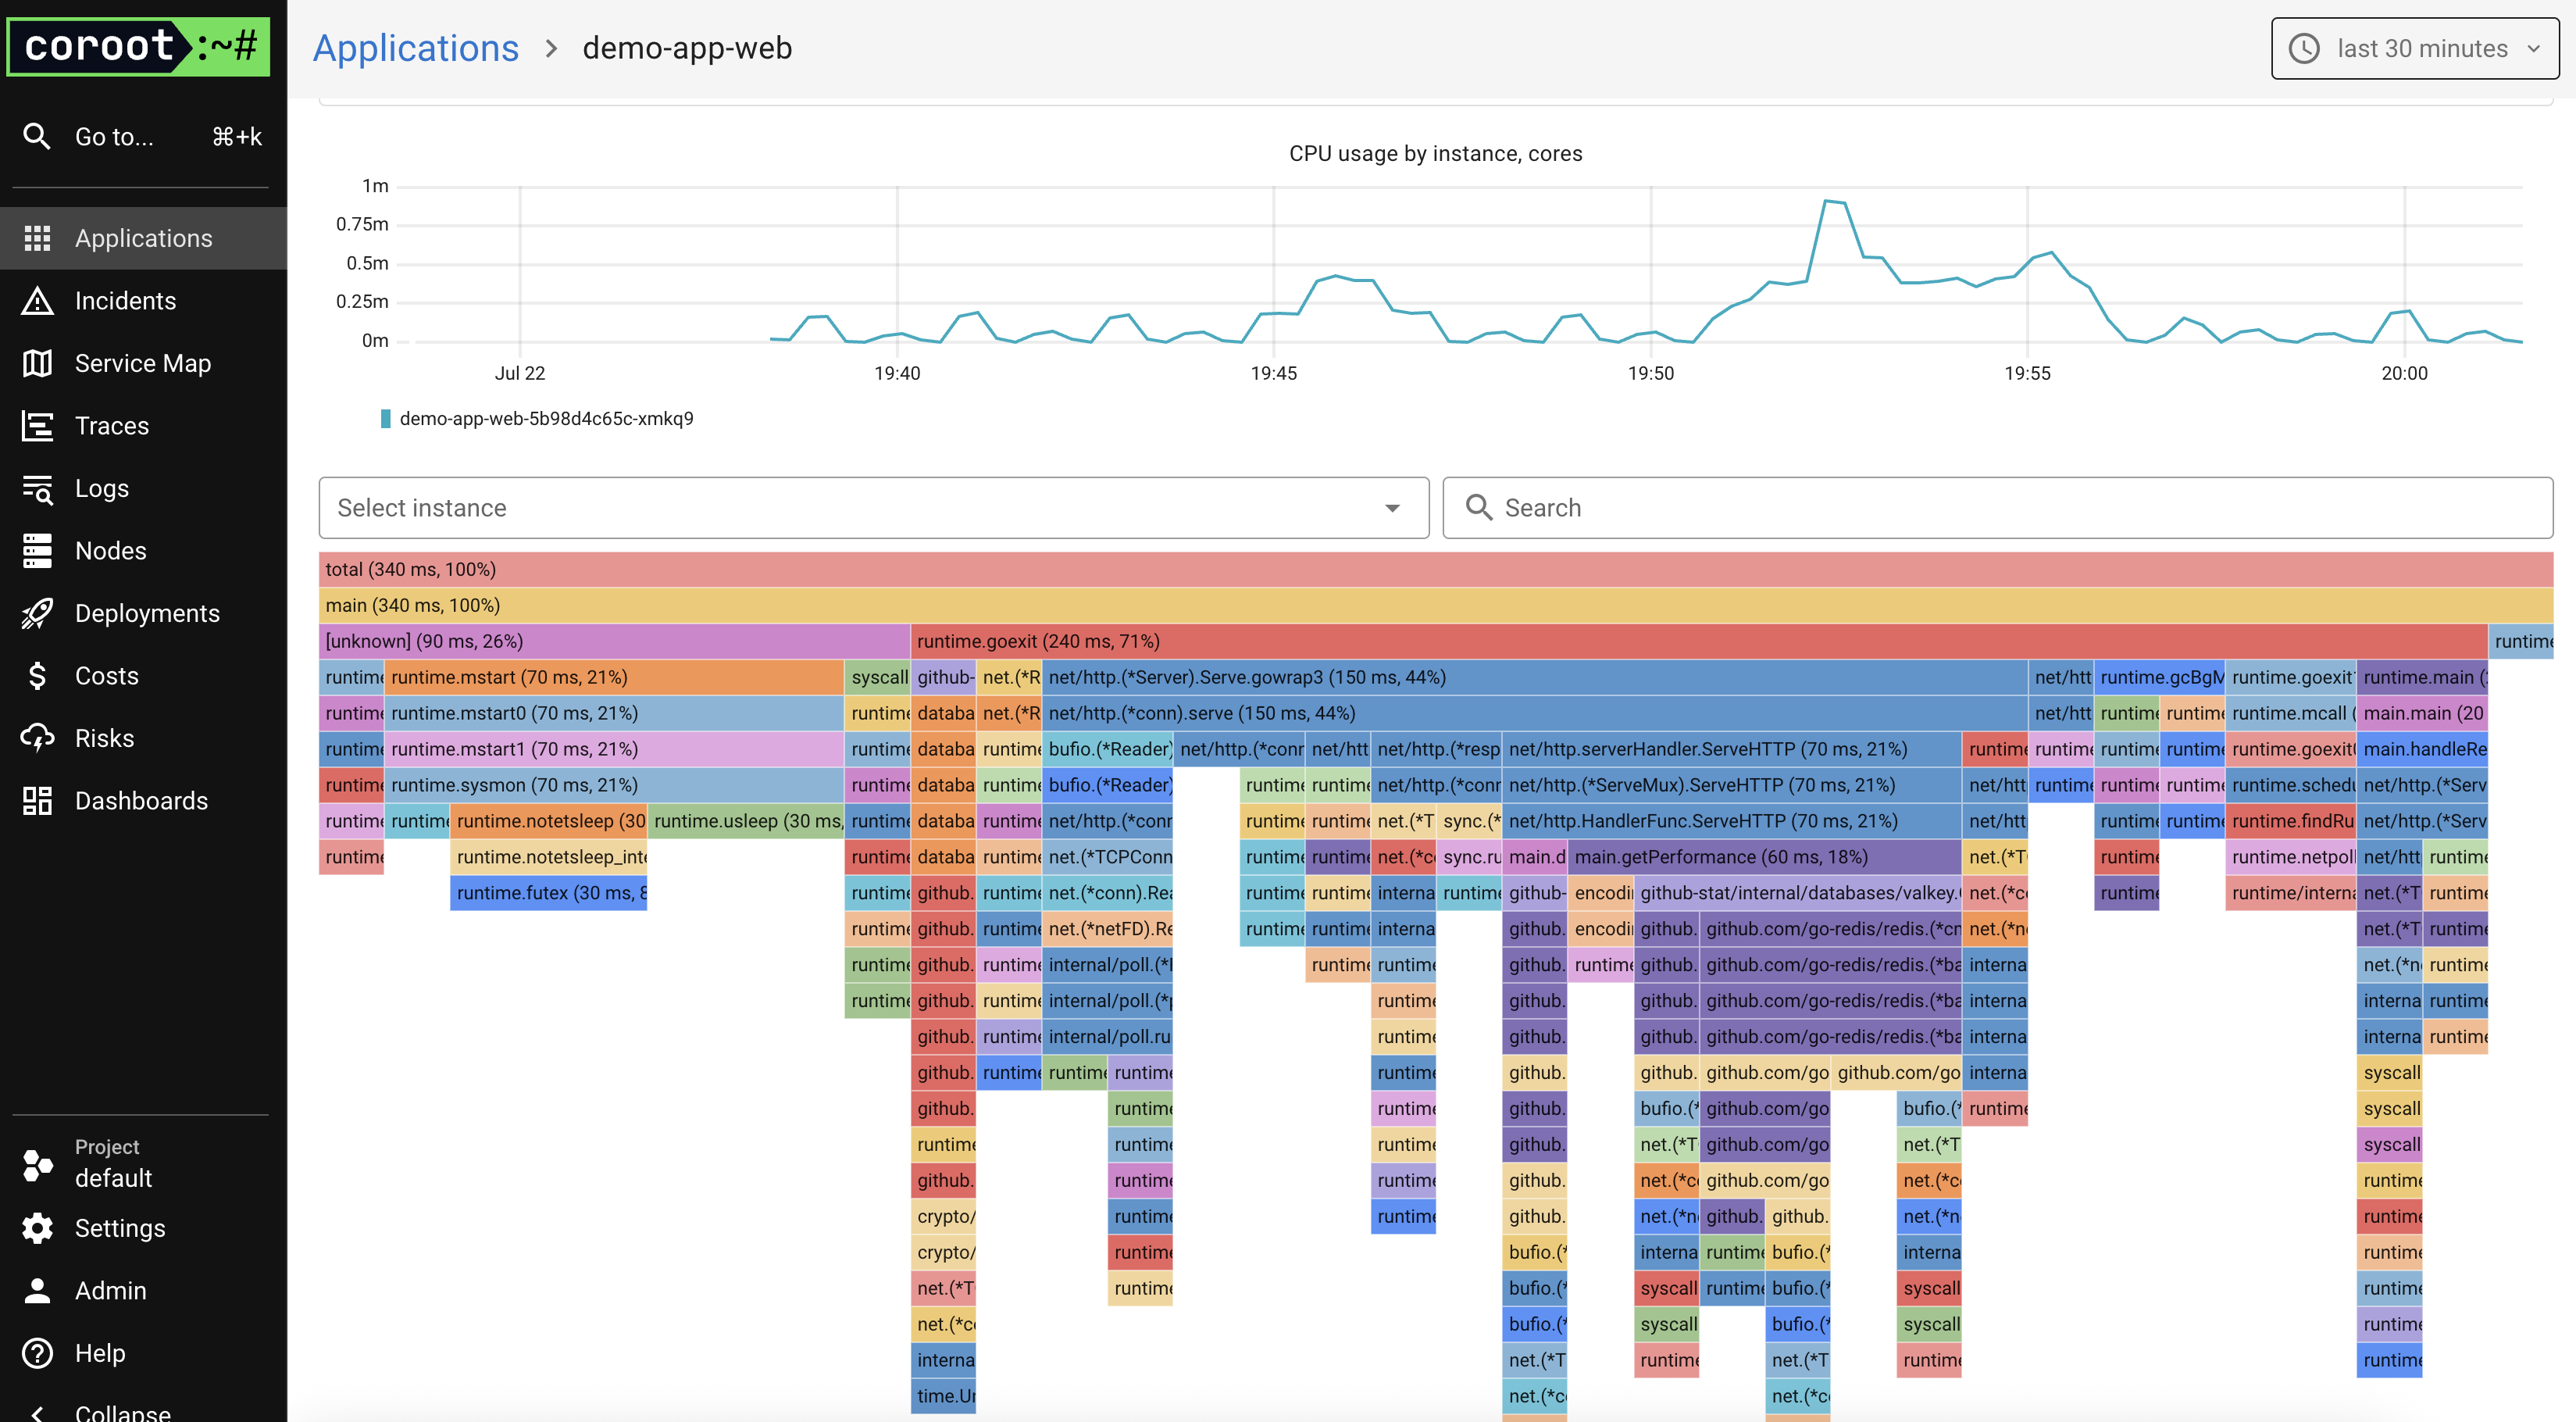
The Profiling tab looks excellent and intuitive. Here’s the Demo App profiling view:
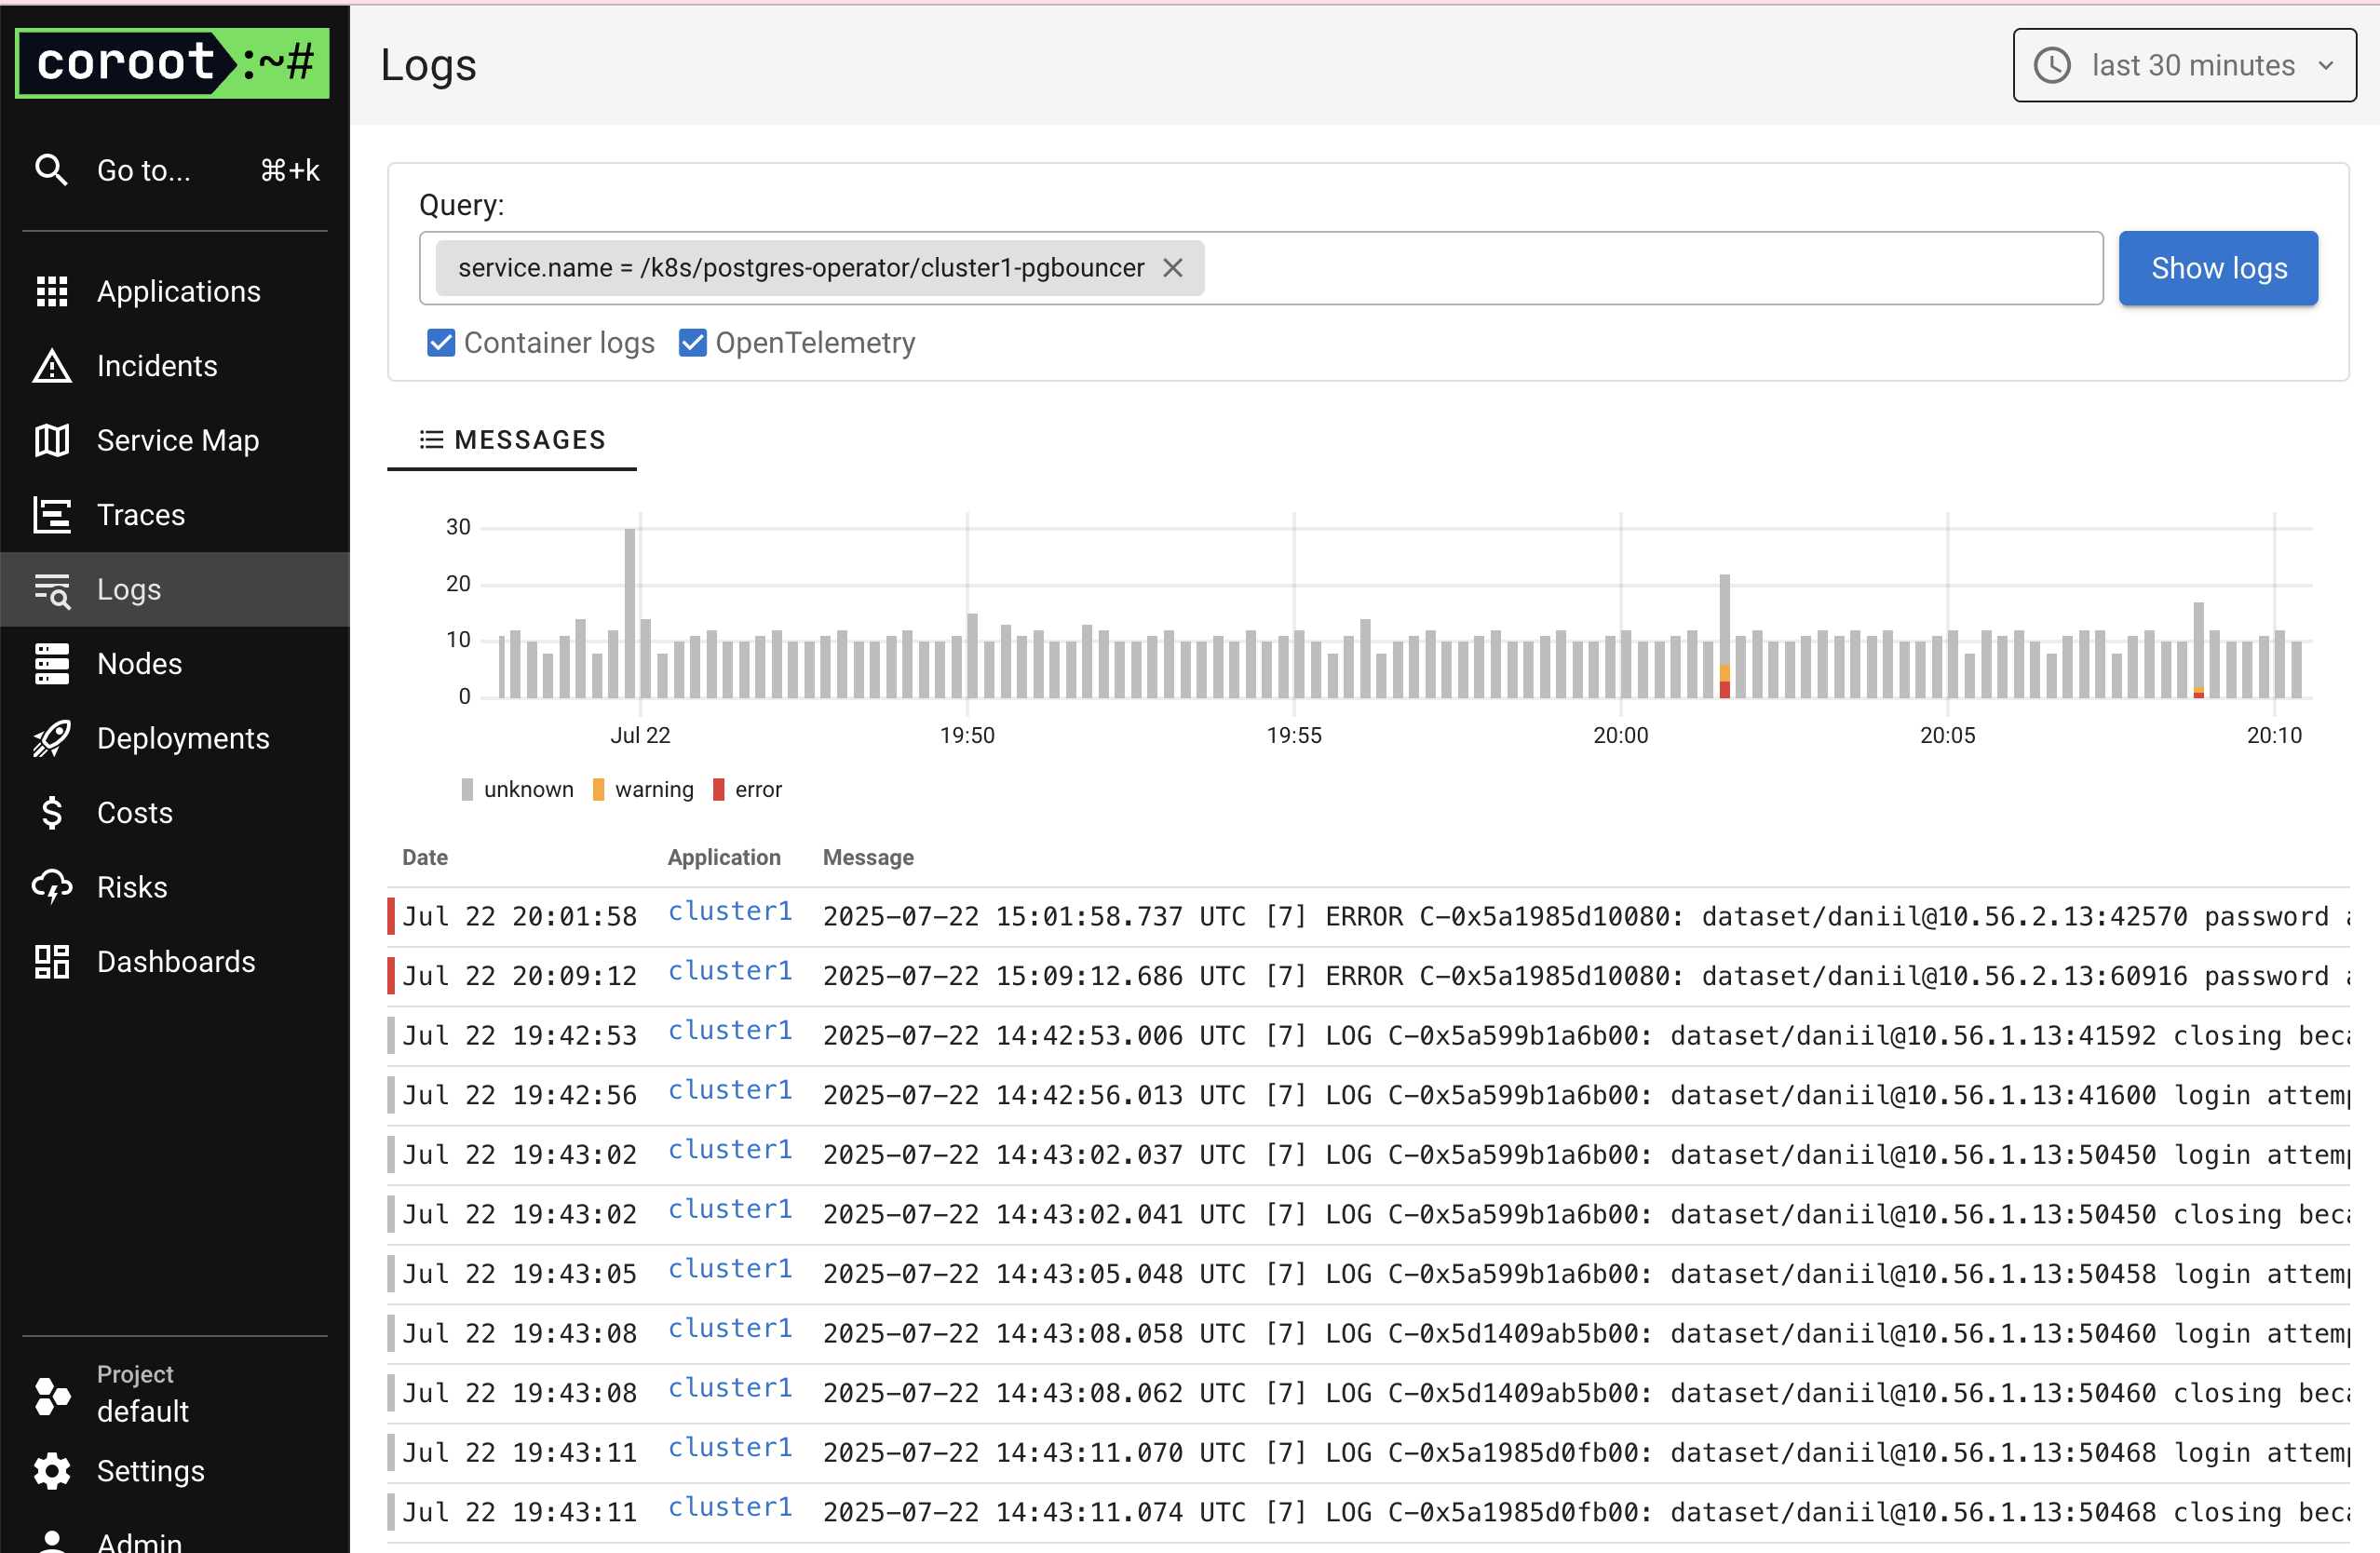
I also triggered an intentional error in the demo app.
Coroot correctly displayed it in both the home view and the app details page.
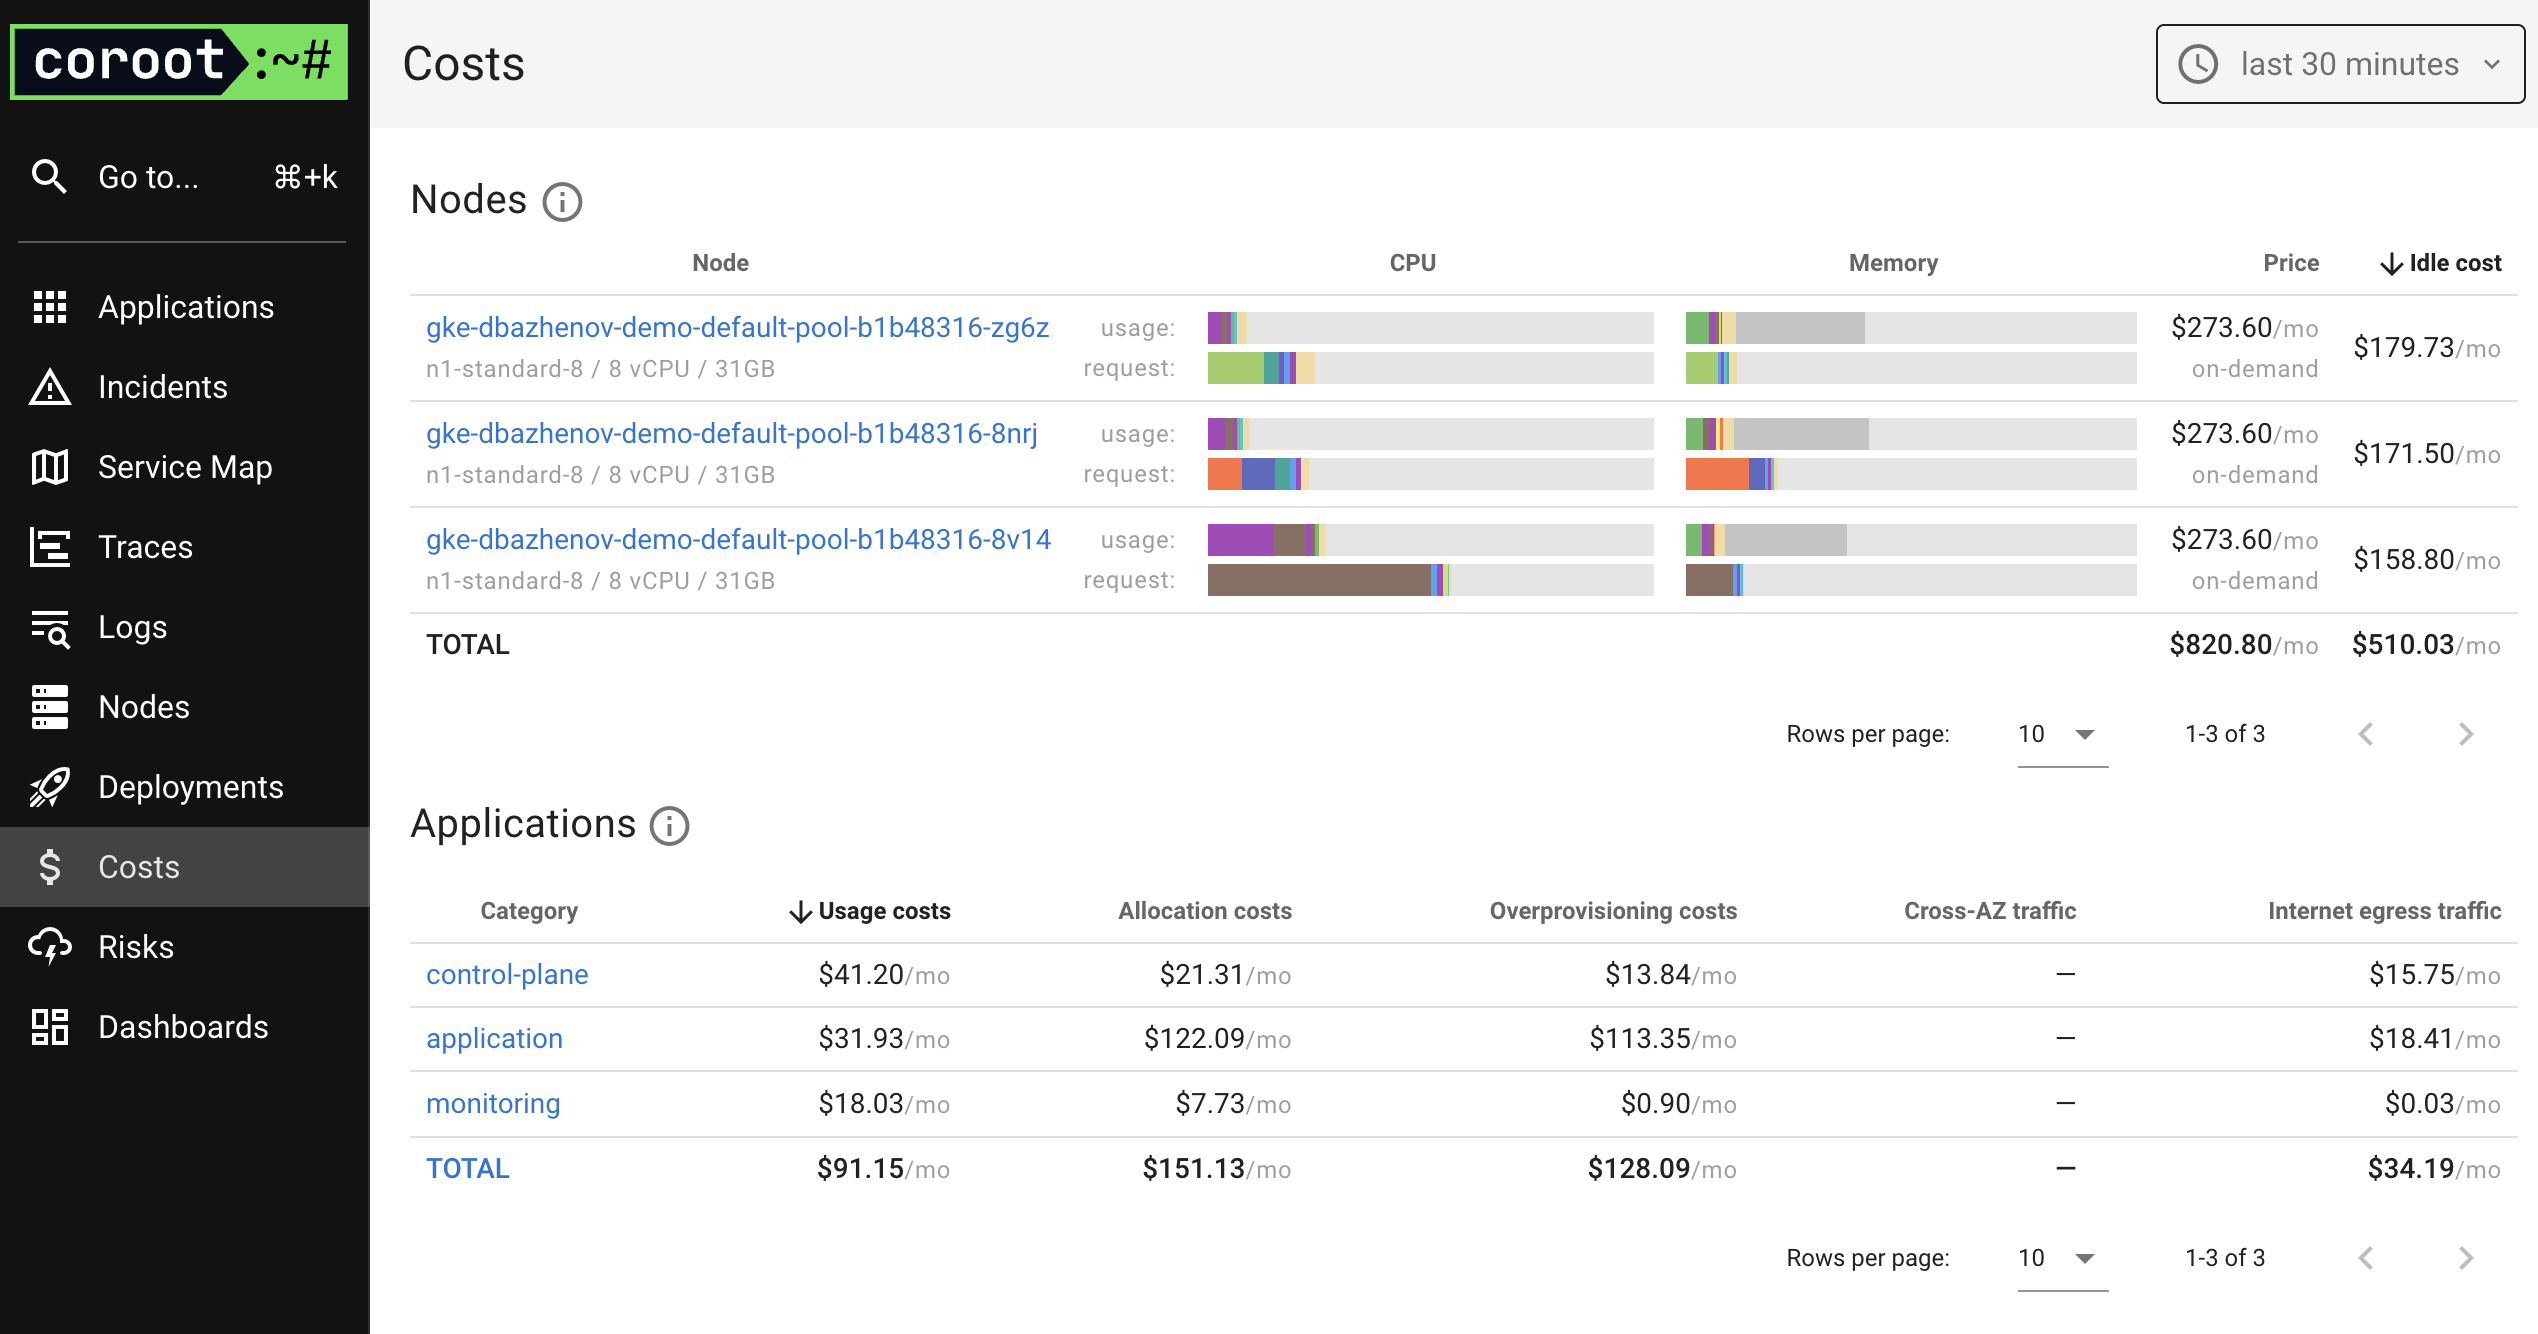
I especially liked the Logs and Costs sections in the sidebar — very well implemented.
First Incident: Storage Usage in PostgreSQL Turns Yellow
While exploring Coroot and the cluster, I increased the load on the PostgreSQL cluster using the Demo App.
After a short while, I noticed that the Postgres disk was full.
I opened the cluster details and went to the Storage tab.
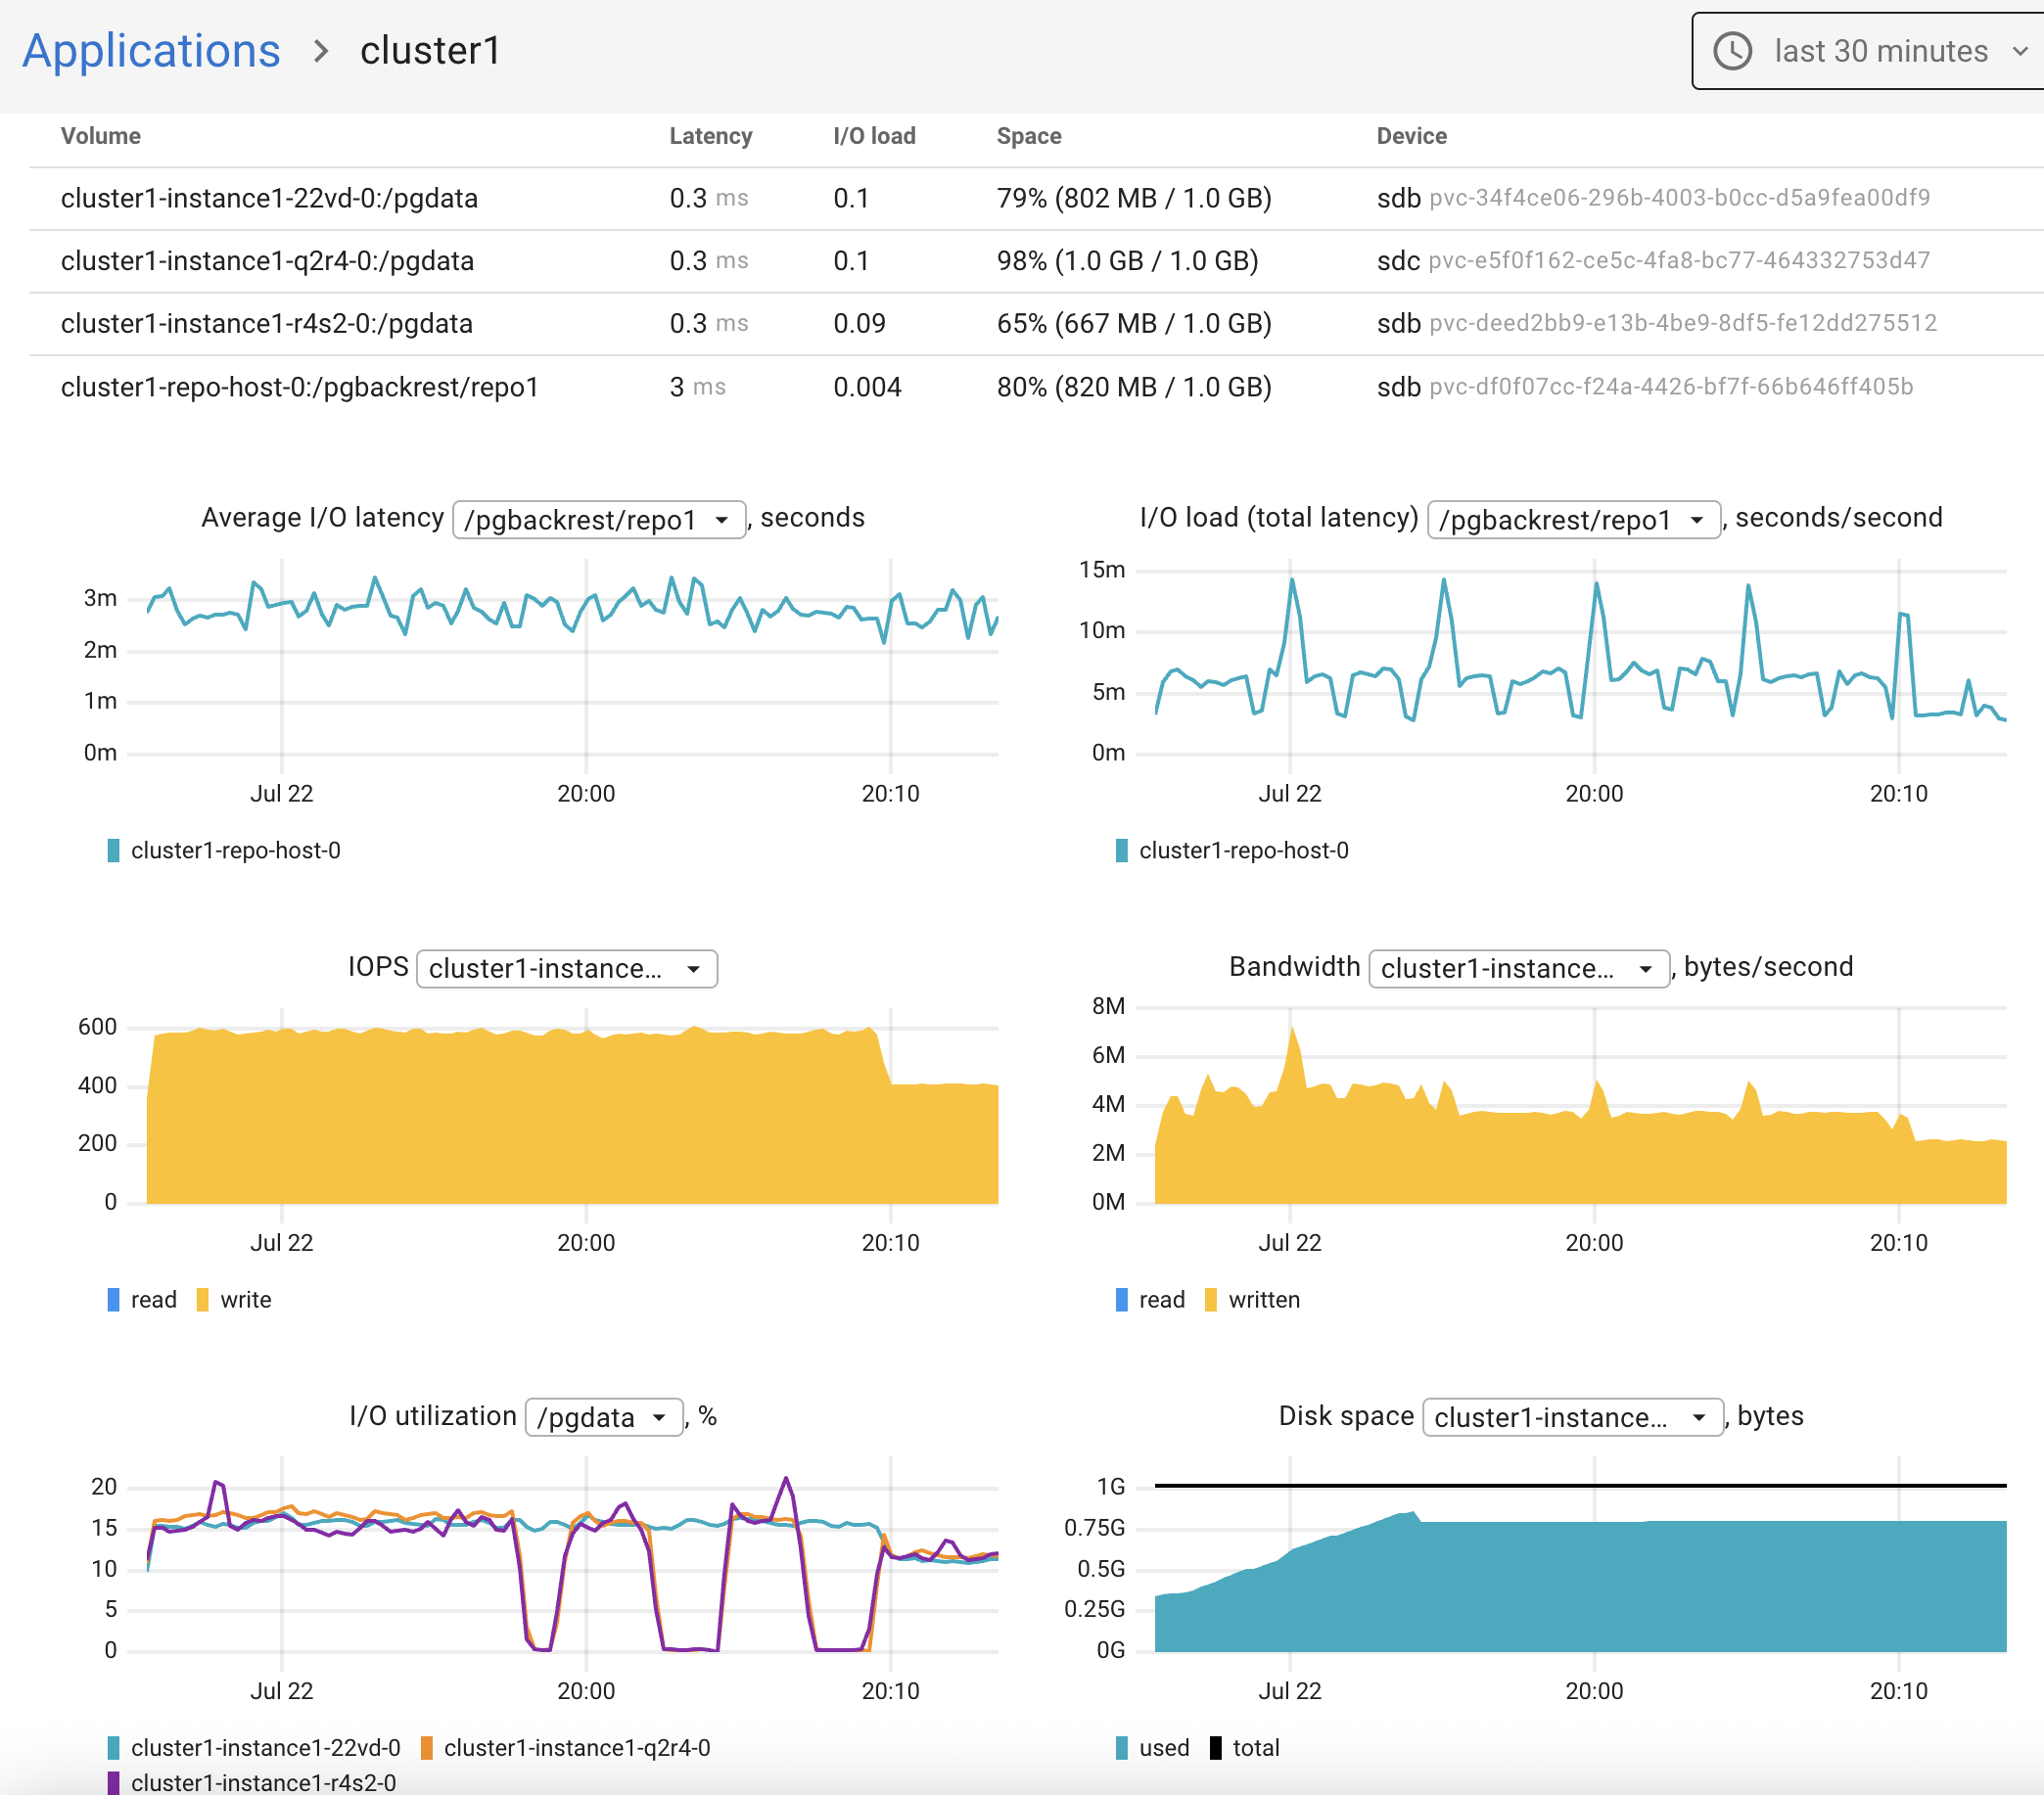
By default, the cr.yaml file allocates just 1Gi of disk space — which is fine for a test setup.
Let’s increase disk size the GitOps way.
Increase Storage Size
Open the file postgres/cr.yaml and locate the section:
    dataVolumeClaimSpec:
#      storageClassName: standard
      accessModes:
      - ReadWriteOnce
      resources:
        requests:
          storage: 1Gi
Change storage from 1Gi to 5Gi.
Note: Backup volumes (pgBackRest) are also enabled by default and set to 1Gi.
      manual:
        repoName: repo1
        options:
         - --type=full
#        initialDelaySeconds: 120
      repos:
      - name: repo1
        schedules:
          full: "0 0 * * 6"
#          differential: "0 1 * * 1-6"
#          incremental: "0 1 * * 1-6"
        volume:
          volumeClaimSpec:
#            storageClassName: standard
            accessModes:
            - ReadWriteOnce
            resources:
              requests:
                storage: 1Gi
Increase this storage to 5Gi as well.
Save changes to cr.yaml, then commit and push to the GitHub repository.
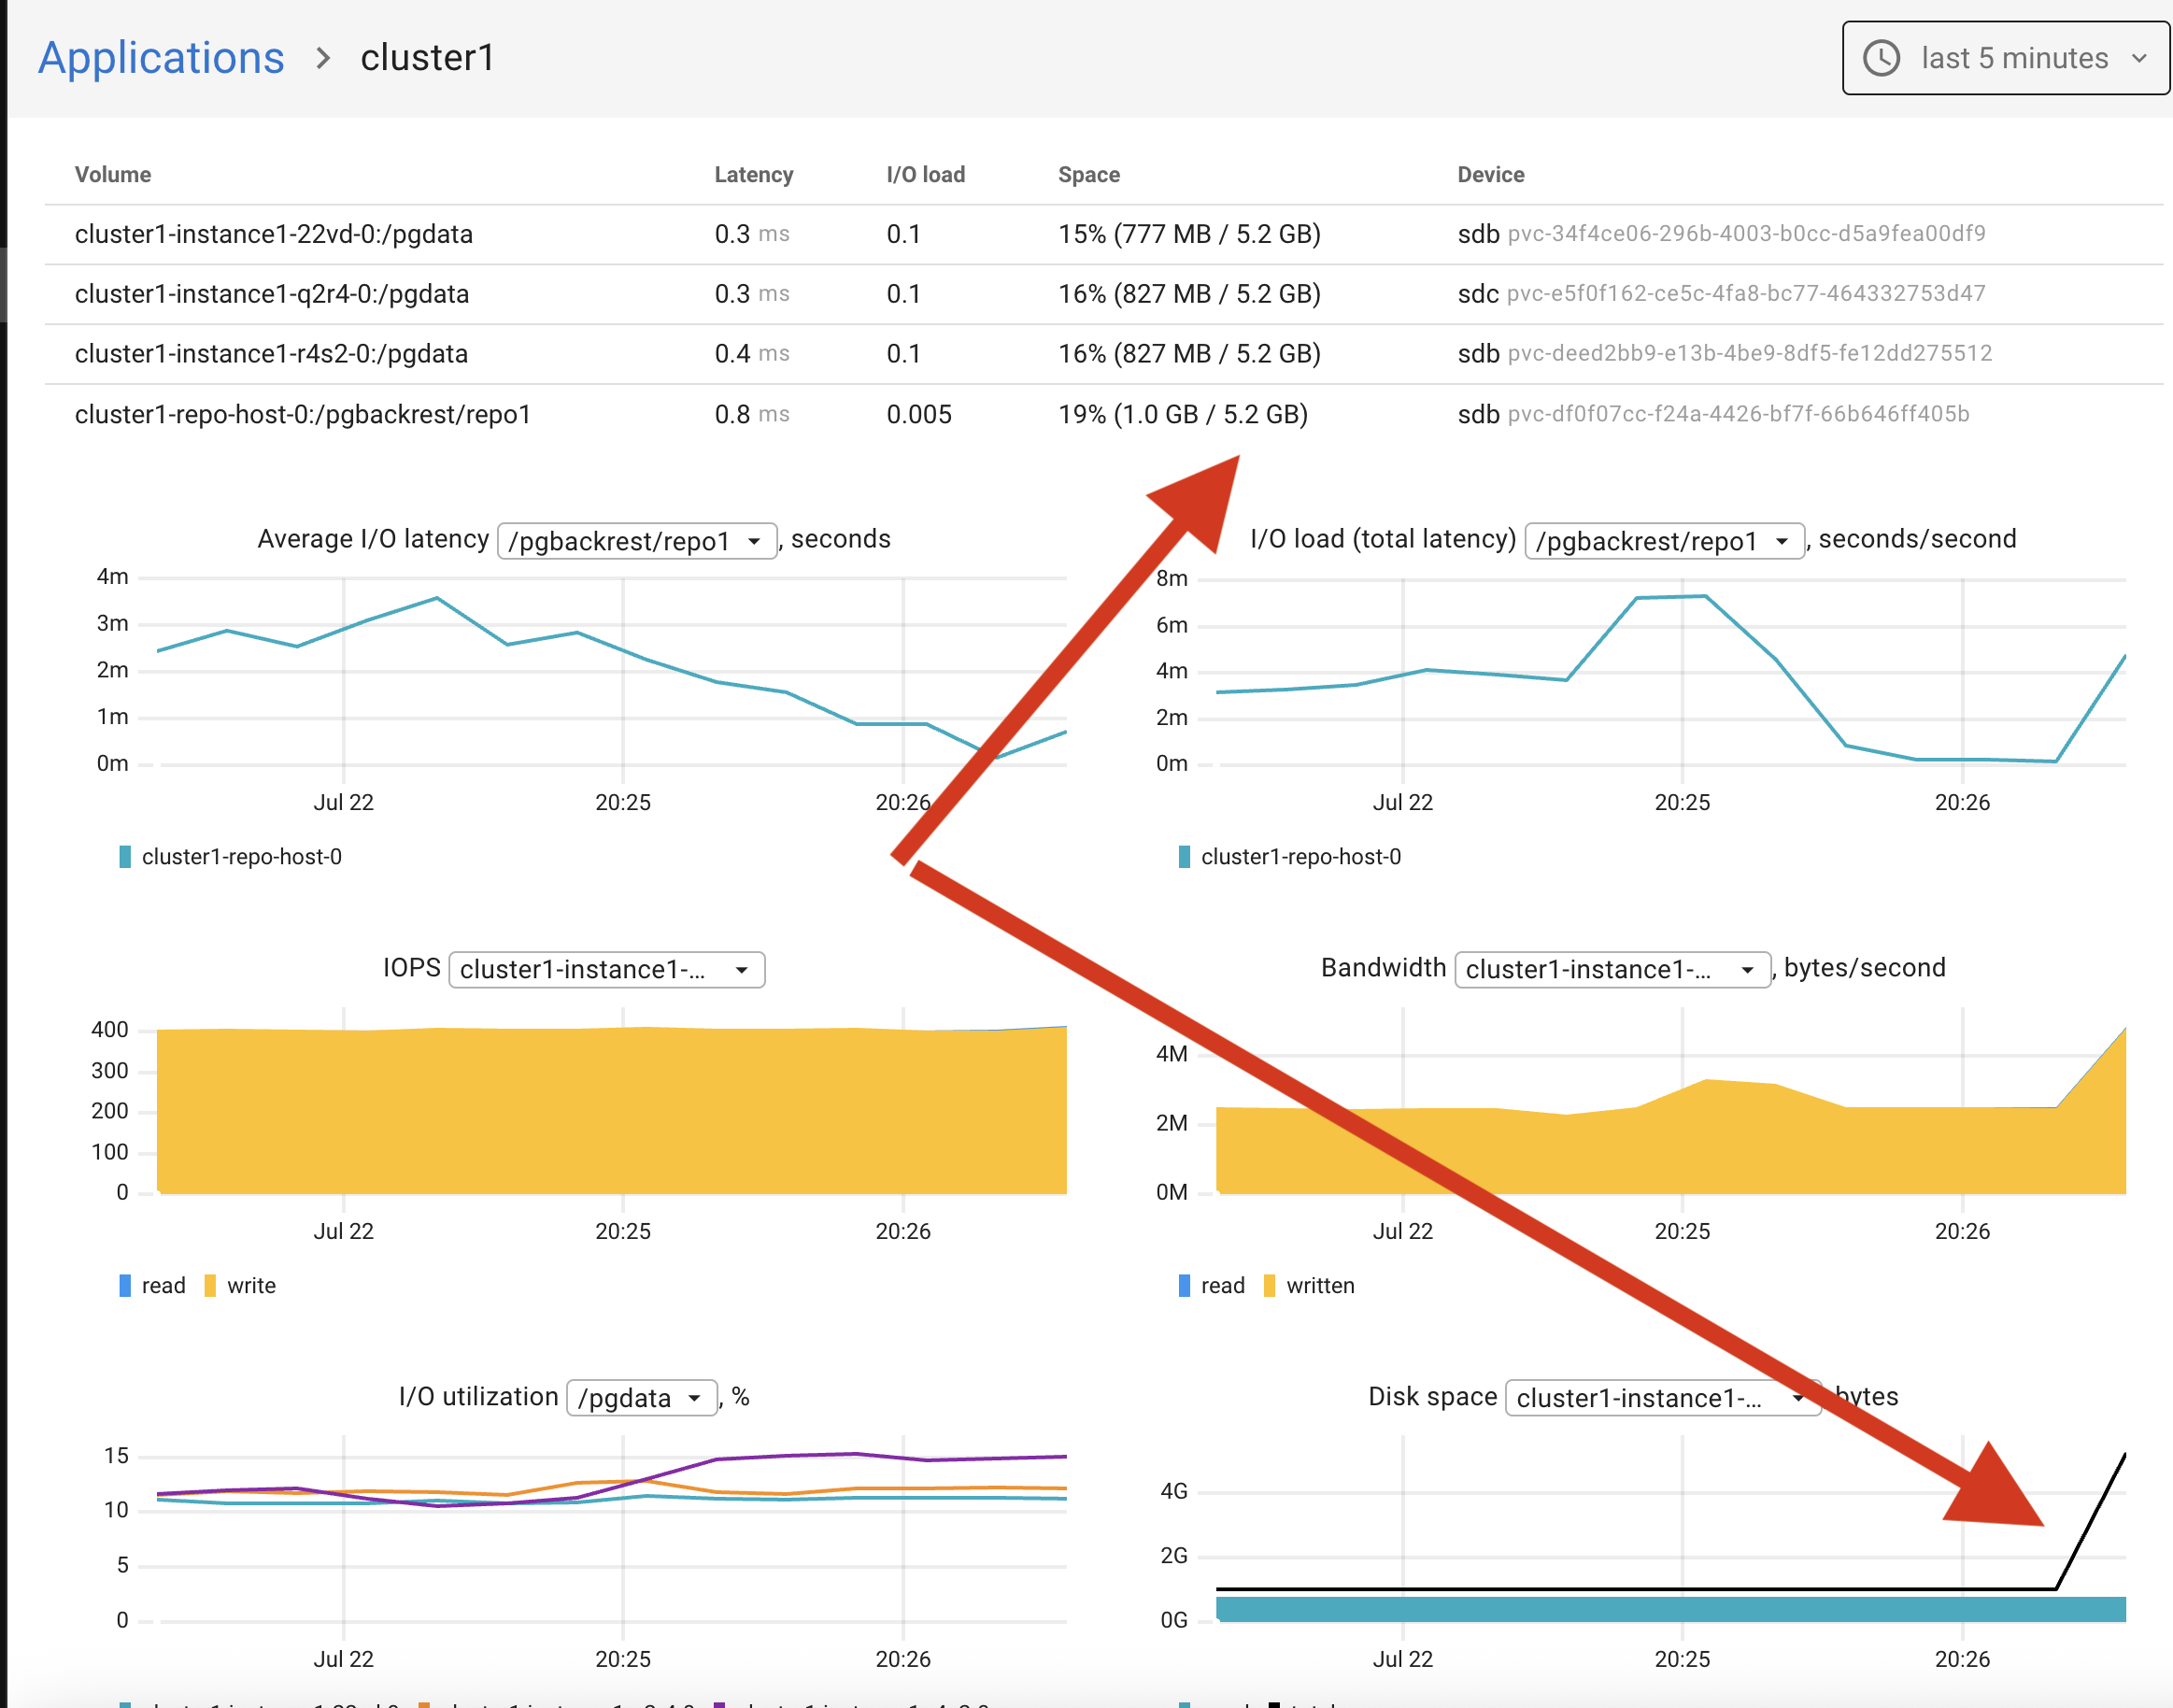
ArgoCD will automatically apply the changes. Pure GitOps magic.
Check the result in Coroot — everything looks great. The disk is increased to 5Gi and the issue is resolved.
Conclusion
We’ve installed and tested a solid monitoring tool, and it really makes a difference.
Across this 4-part series, we walked through the GitOps journey step by step:
Part 1 - Created a Kubernetes cluster, installed ArgoCD, and set up a GitHub repository.
Part 2 - Deployed a PostgreSQL cluster using Percona Operator for PostgreSQL.
Part 3 - Deployed a demo app via ArgoCD using Helm.
Installed and tested Coroot, an excellent open-source observability tool.
Managed the PG cluster through GitHub and ArgoCD — scaled replicas, created users, resized volumes, configured access, and more.
Thank you for reading — I hope this series was helpful.
The project files are available in my repository https://github.com/dbazhenov/percona-argocd-pg-coroot
I’d love to hear your questions, feedback, and suggestions for improvement. ∎


Discussion
We invite you to our forum for discussion. You are welcome to use the widget below.