
Dolphie, your real-time MySQL monitoring assistant
For as long as I can remember, Innotop has been the go-to terminal tool for real-time MySQL monitoring. It is an invaluable addition to any DBA’s toolkit, but unfortunately, it’s not really actively maintained these days, except for addressing critical issues, and it hasn’t kept pace with the evolving capabilities of modern terminals. With no viable alternatives except for InnotopGo, which is also no longer actively maintained and limited to MySQL 8 (while many still use 5.7), I decided to build my own in Python.

Initially, I relied on Python’s Rich package for the user interface. However, I recently stumbled upon Textual a few months ago, and it piqued my interest. It’s a framework that extends the capabilities of Rich, opening up a world of possibilities in the terminal. After experimenting with it for a few days, it inspired me to redevelop Dolphie with it, and I’ve been thoroughly pleased with the results. It has allowed me to showcase many of the features that will be displayed in this blog post!
Getting started
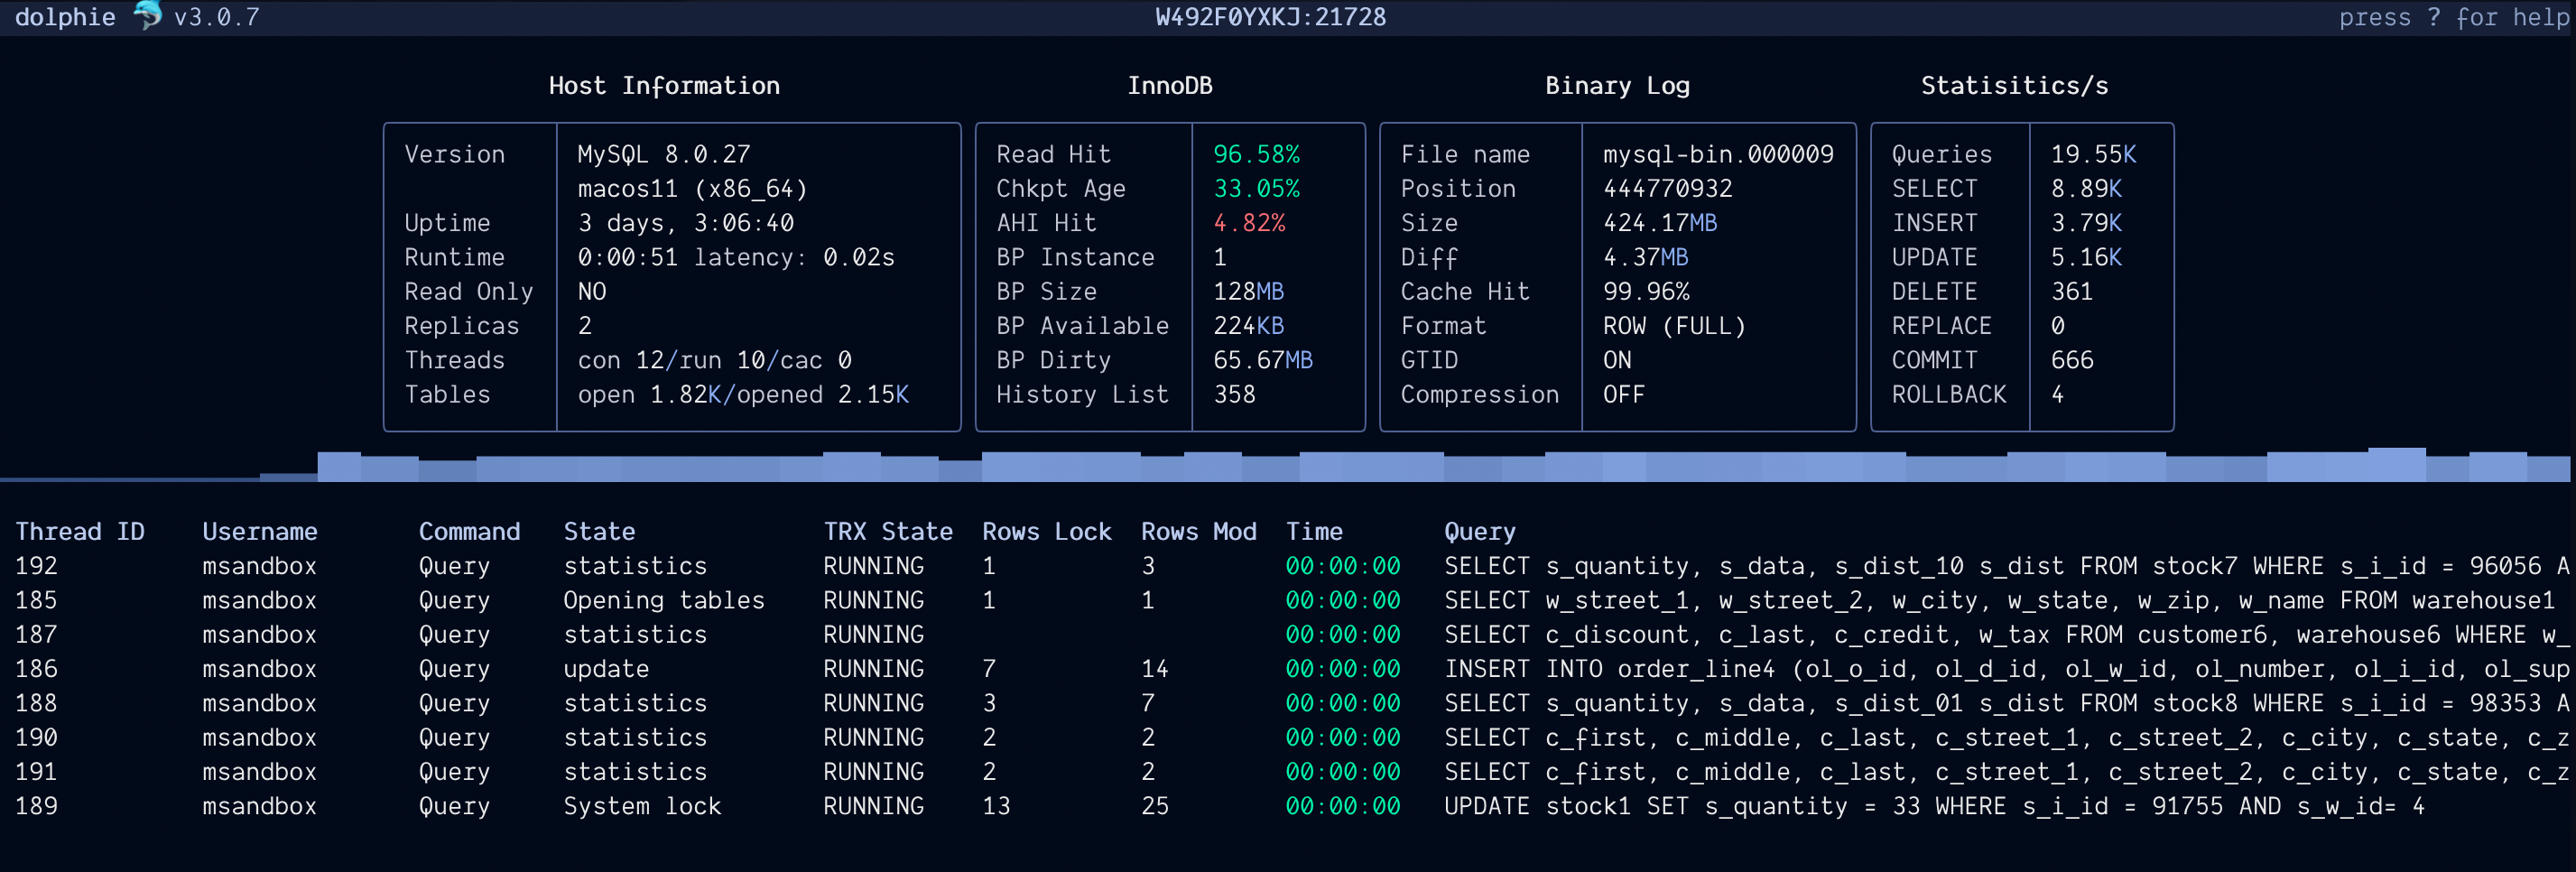
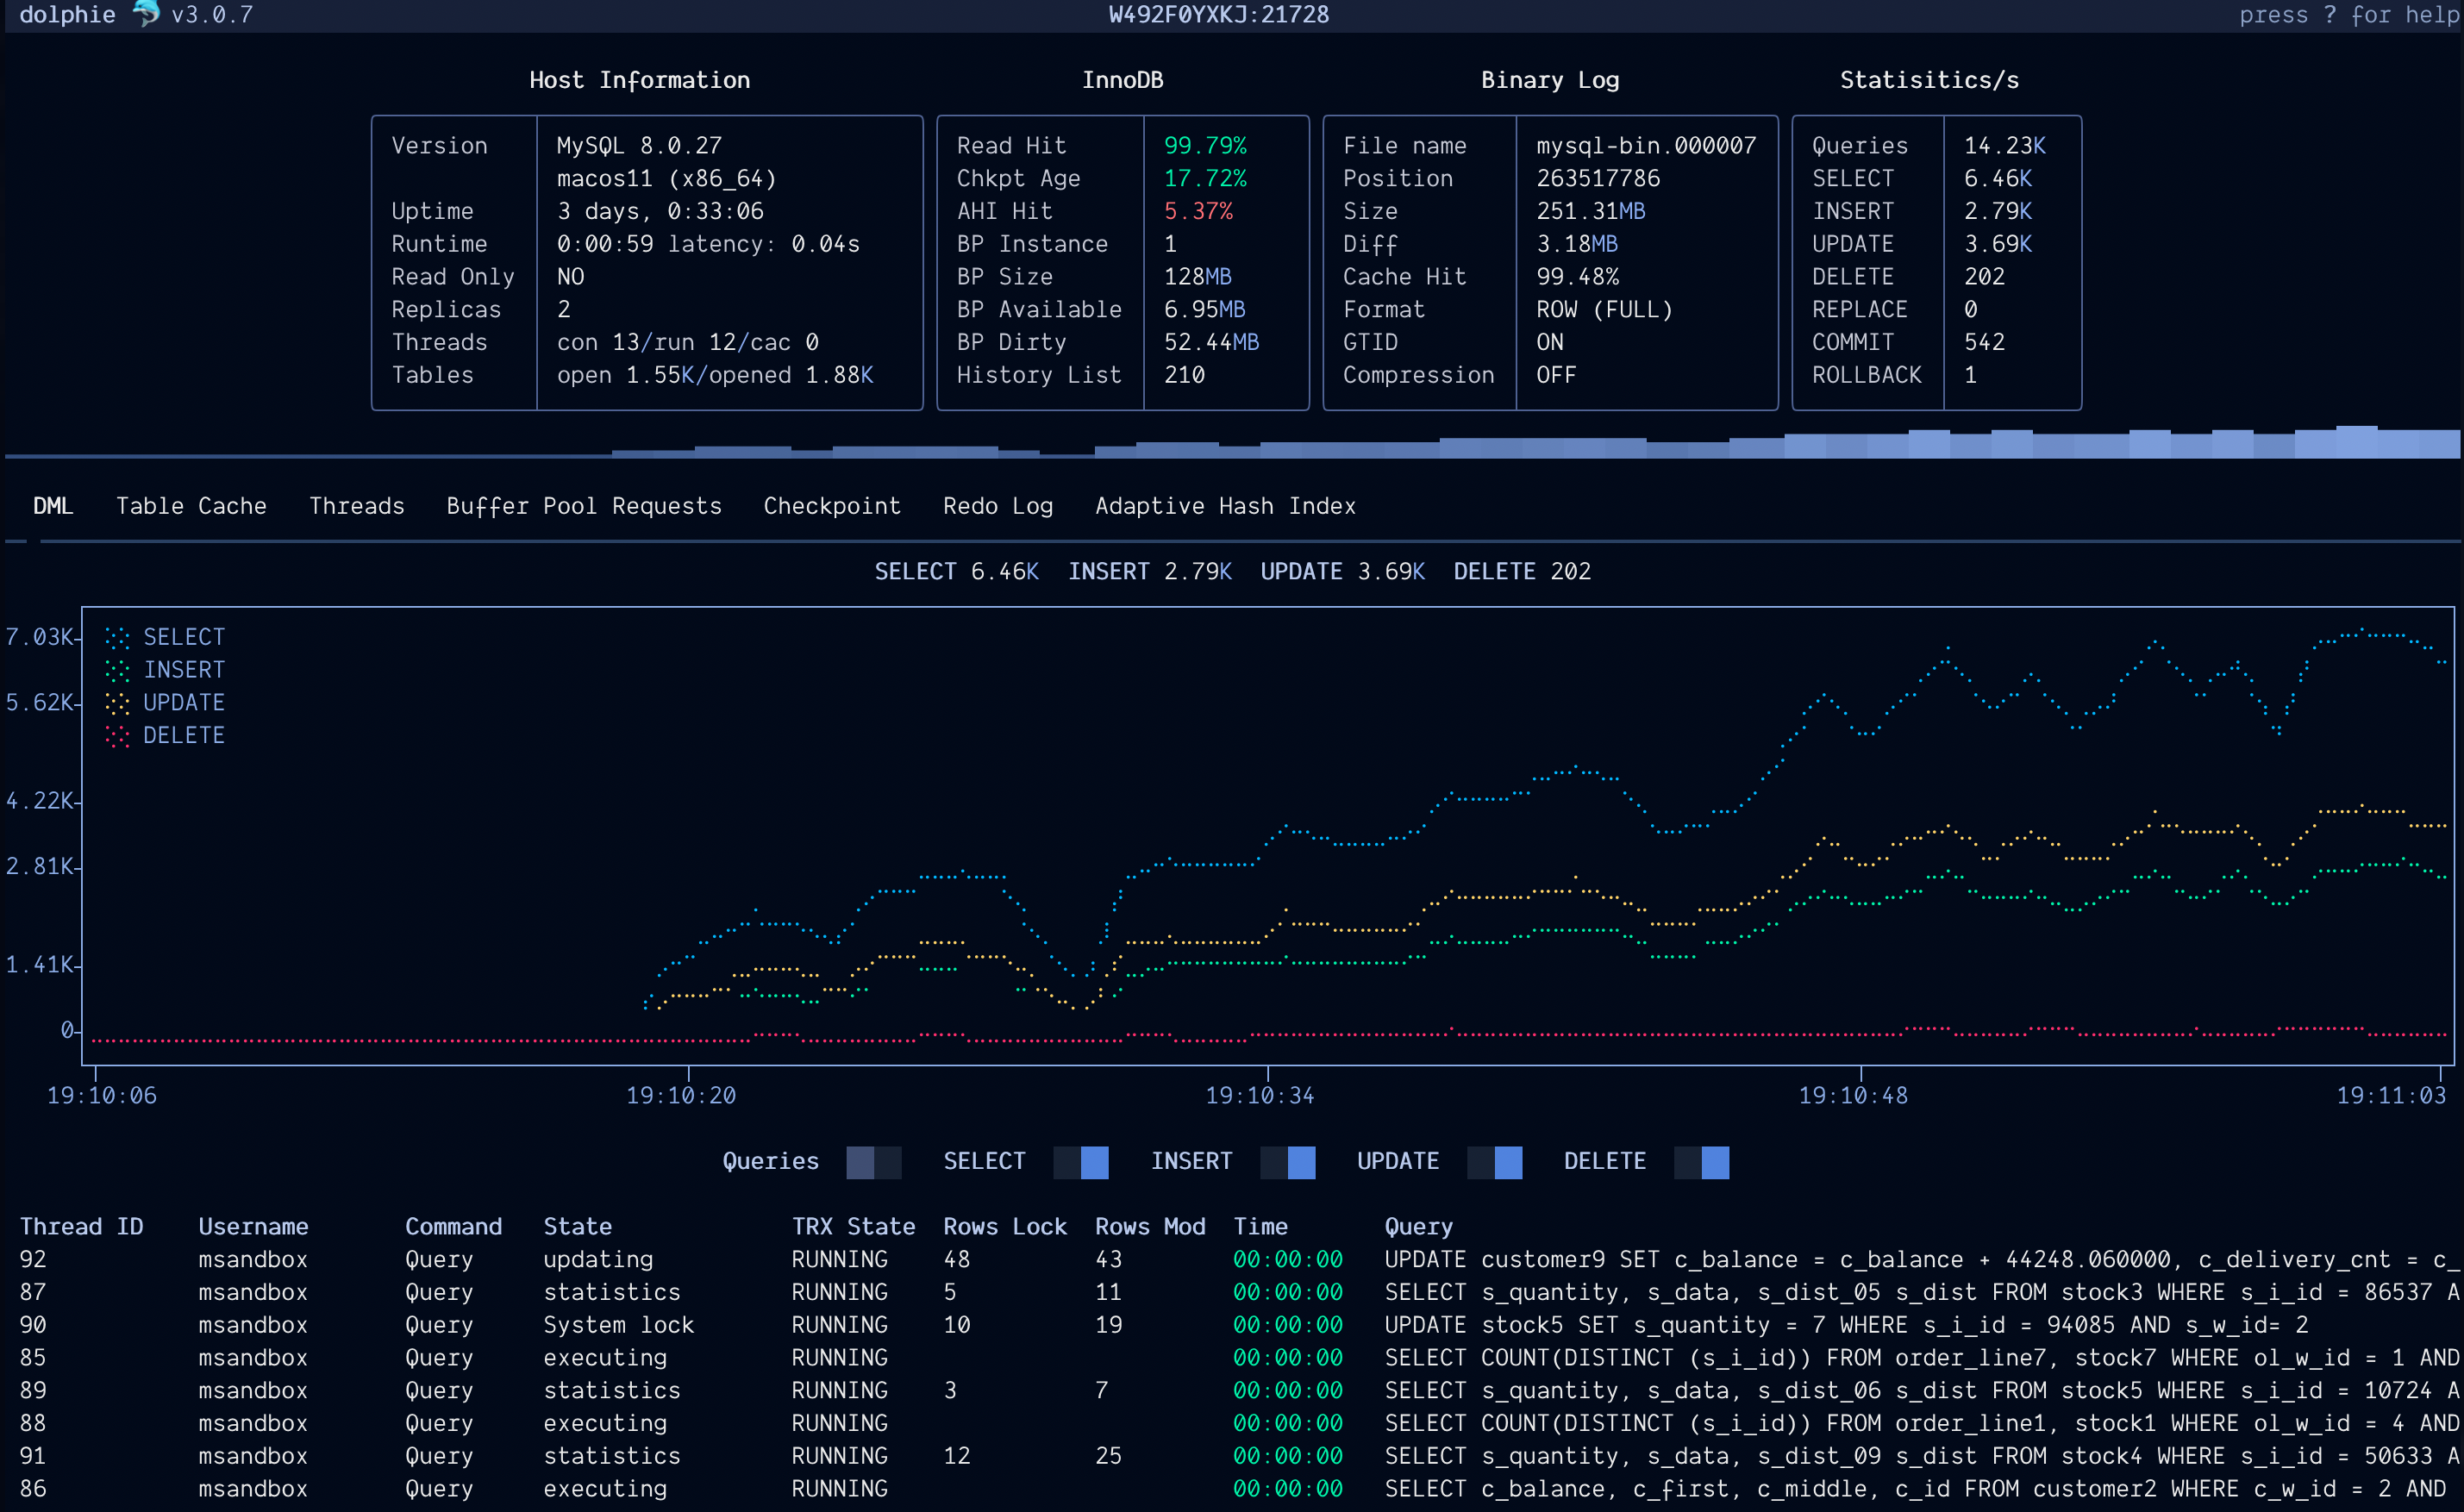
When you first start Dolphie, you’ll be greeted with a dashboard displaying various important MySQL metrics, along with a sparkline below it to measure the QPS (Queries per second) + process list. There are multiple ways to manipulate the process list, such as changing how it sorts, filtering by user/host/query text/database/time, killing threads, and much more.
There are currently four panels that can be toggled interchangeably for display:
- Dashboard
- Process list
- Replication/Replicas
- Graph Metrics
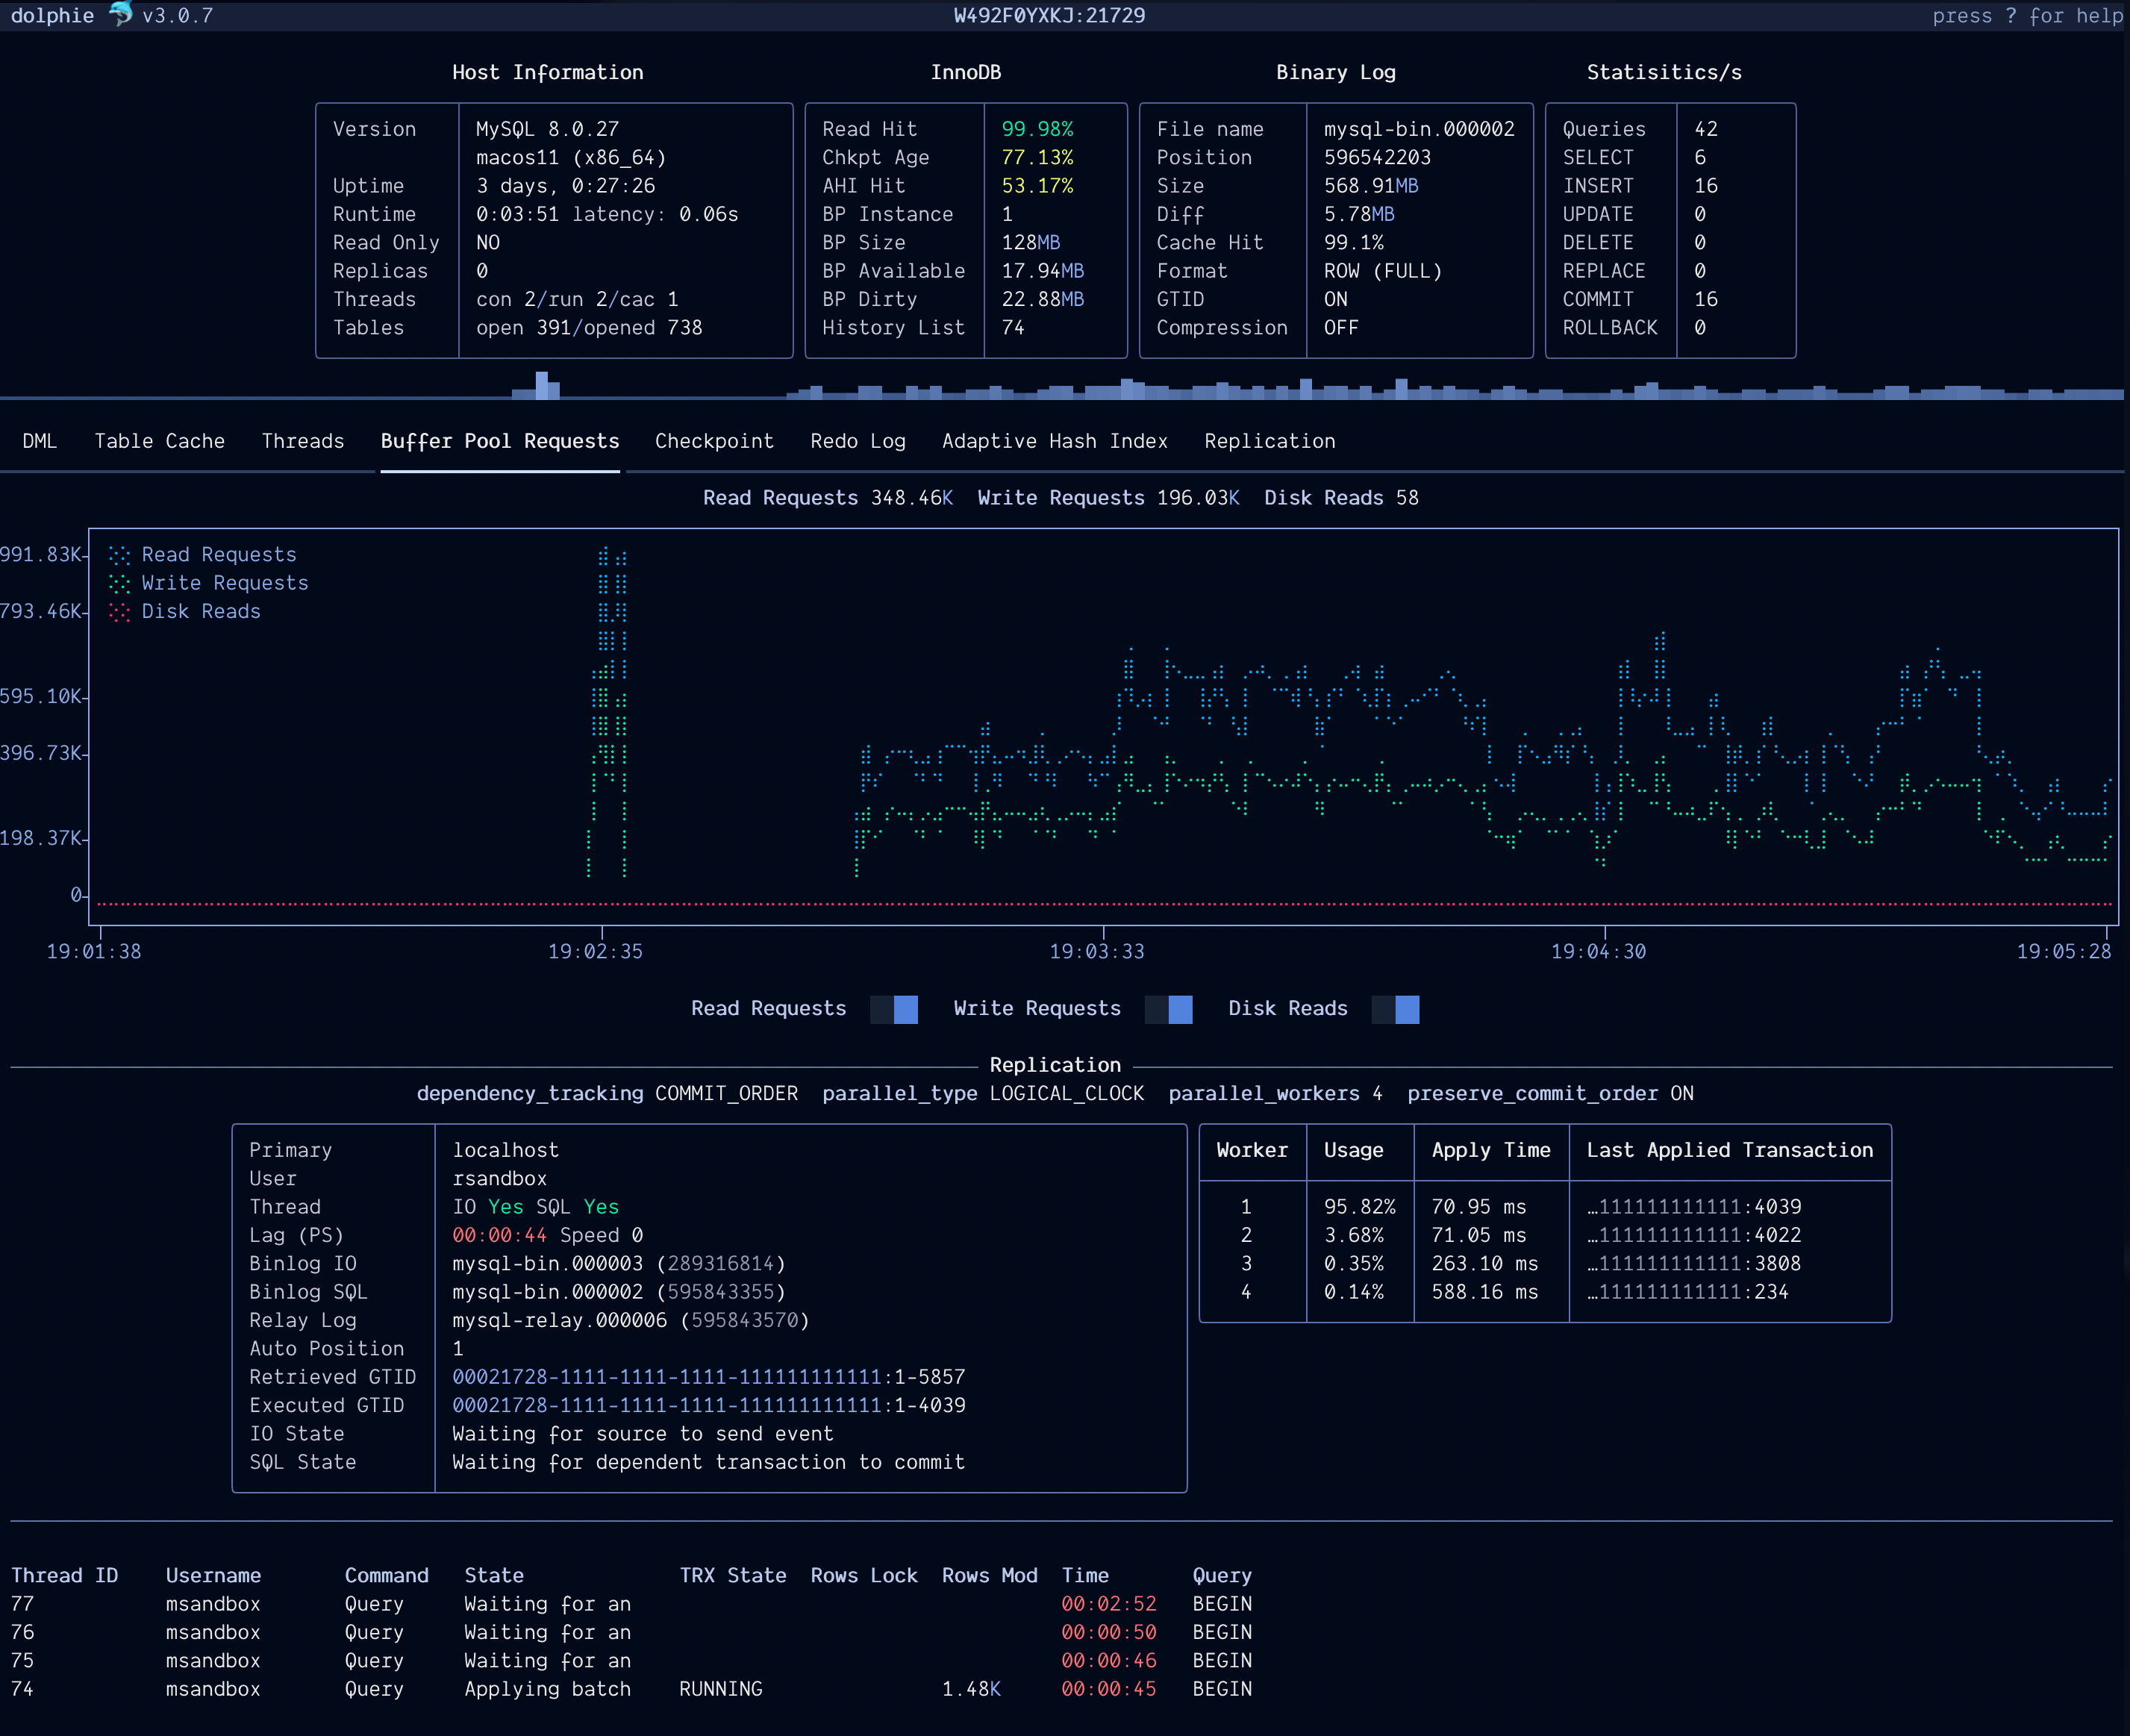
A big perk of transitioning to Textual is the integration of graphs. It’s as if I’ve incorporated a mini-PMM (Percona Monitoring and Management) right into Dolphie! The switches you see can be toggled on and off to display or hide their corresponding metrics on the graph.
Buffer Pool Requests Graph + Replication Panel
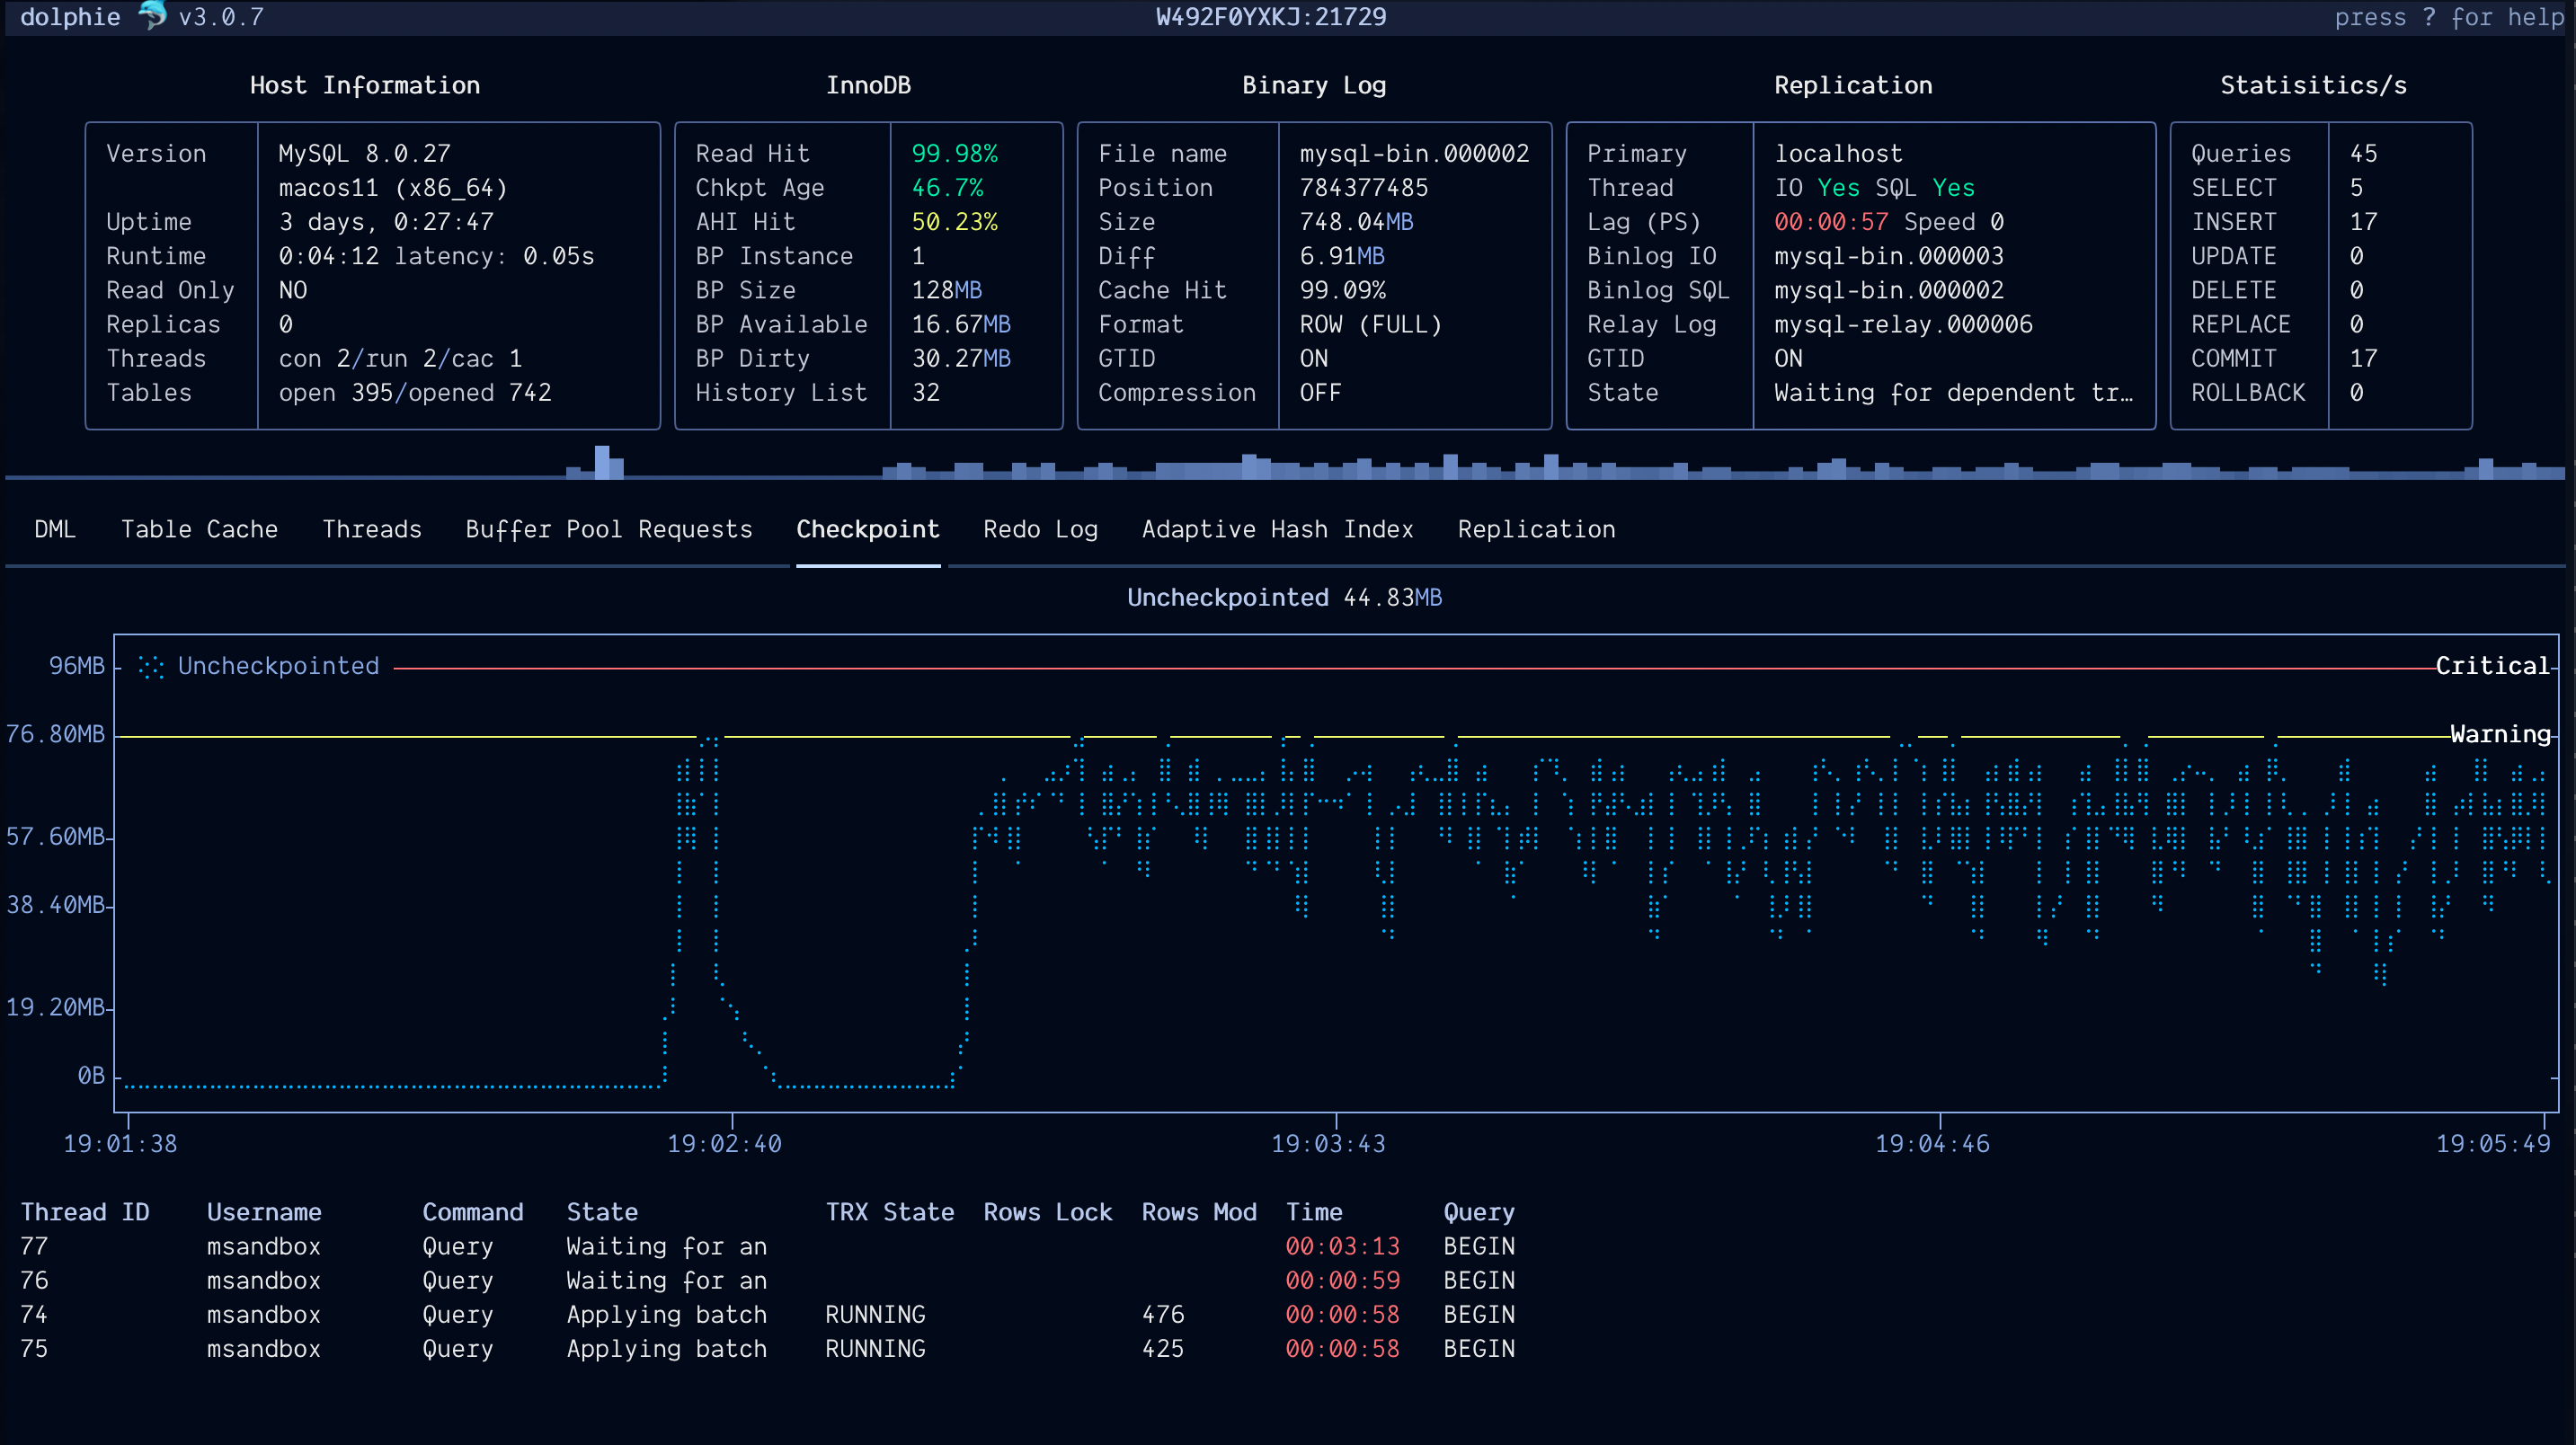
Checkpoint Graph
Redo Logs Graph
How are your redo logs performing? Dolphie shows you how much data is being written per second, the active count of redo logs (MySQL 8 only), and how much data is being written to it per hour (inspired by this blog post)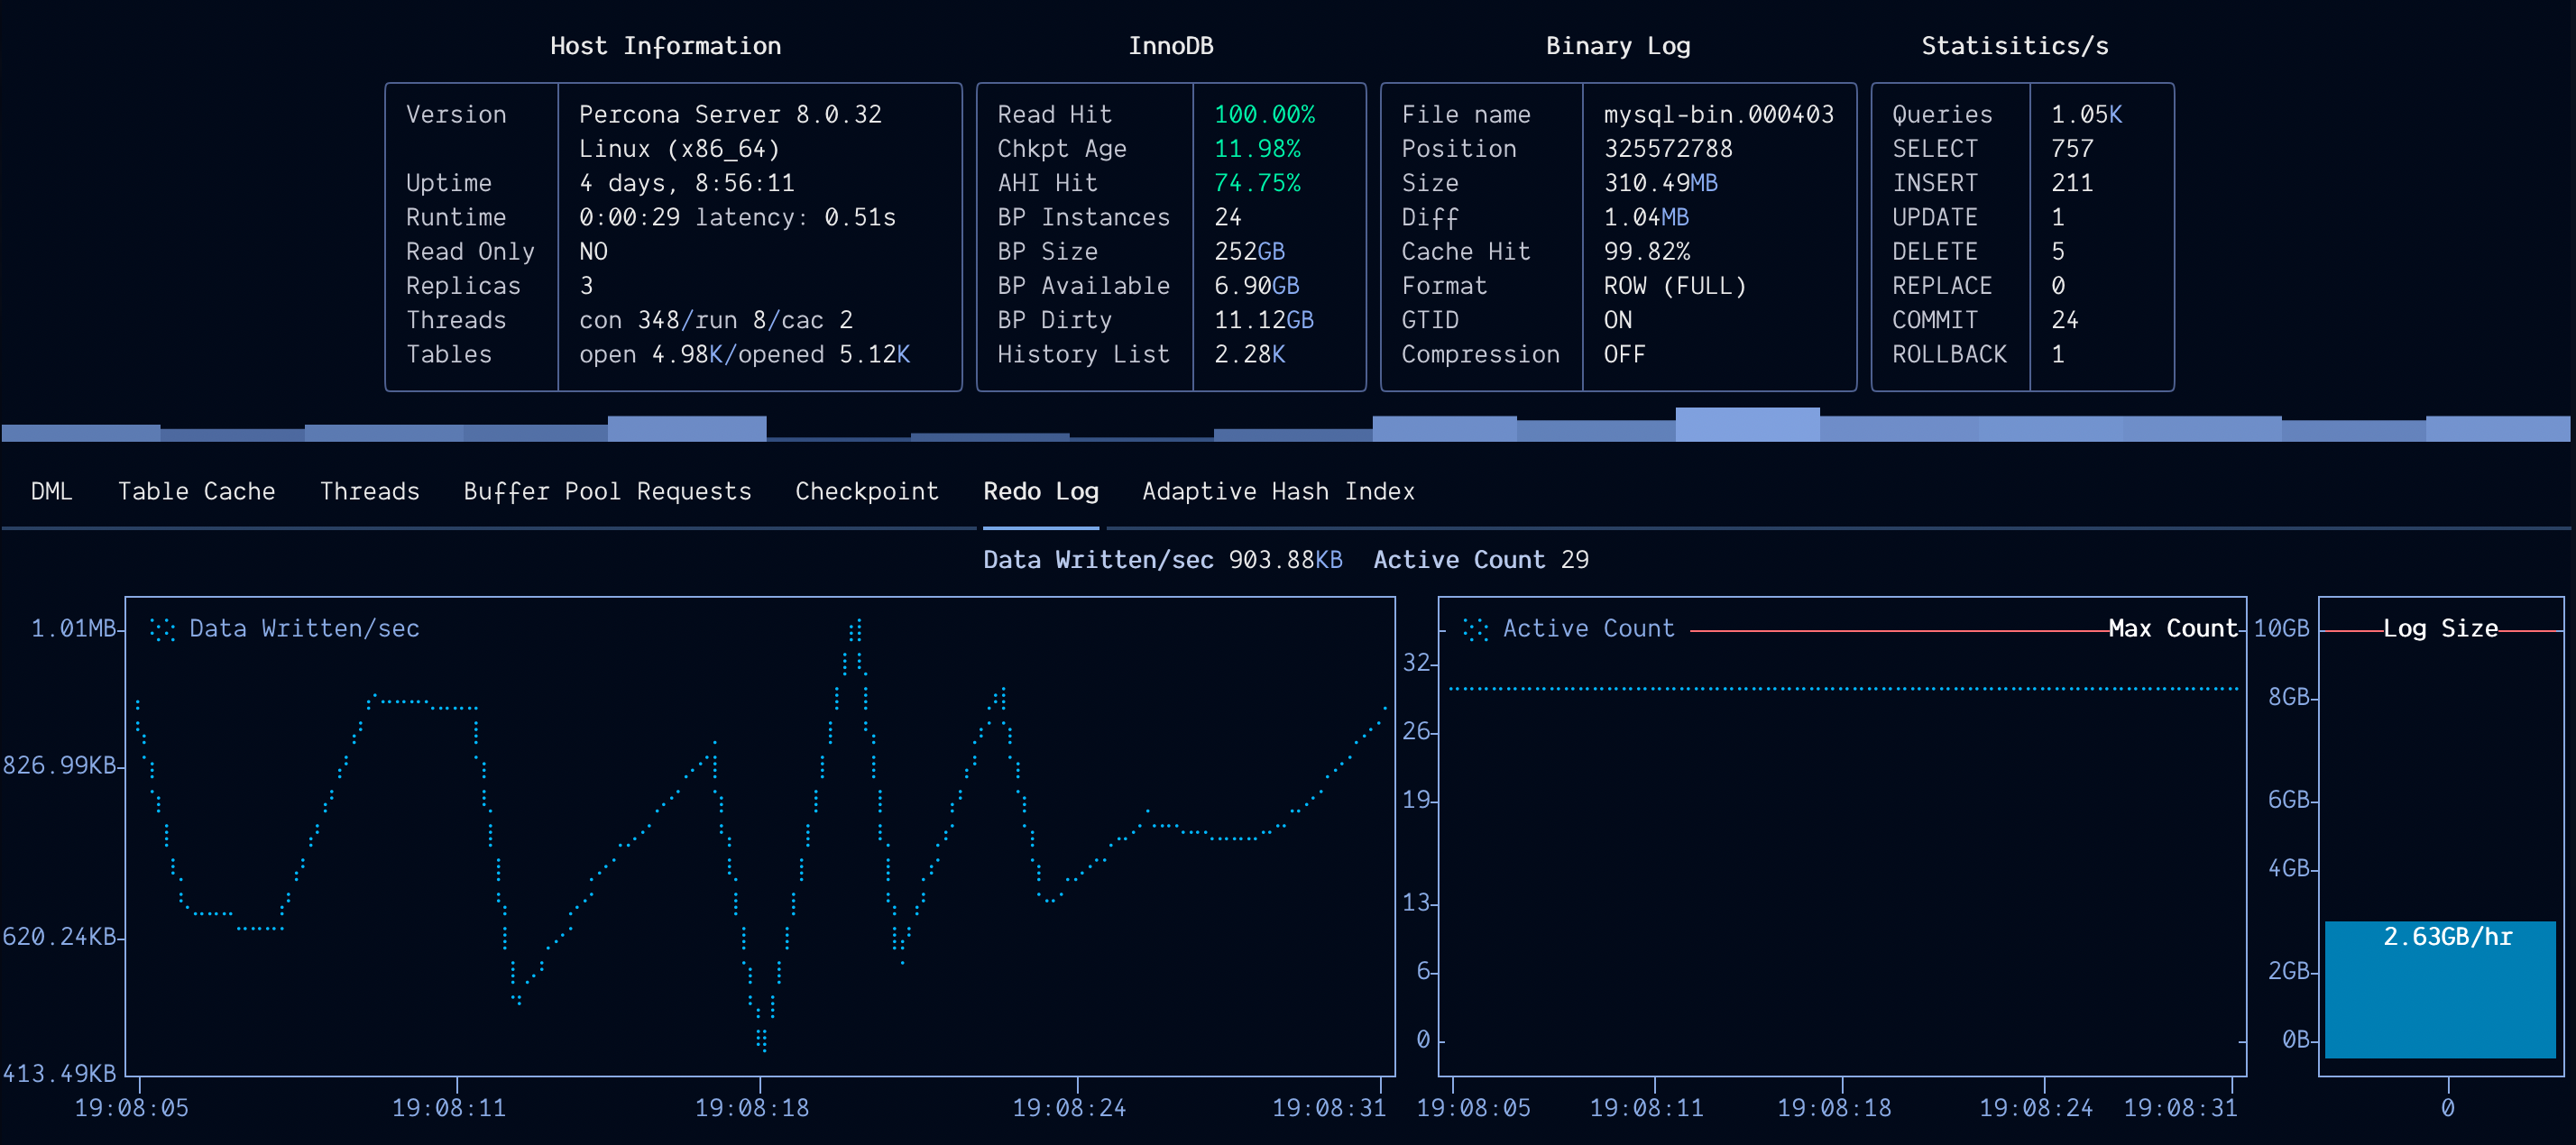
DML Graph
Thread data
Dolphie lets you display a thread’s information with an explanation of its query along + transaction history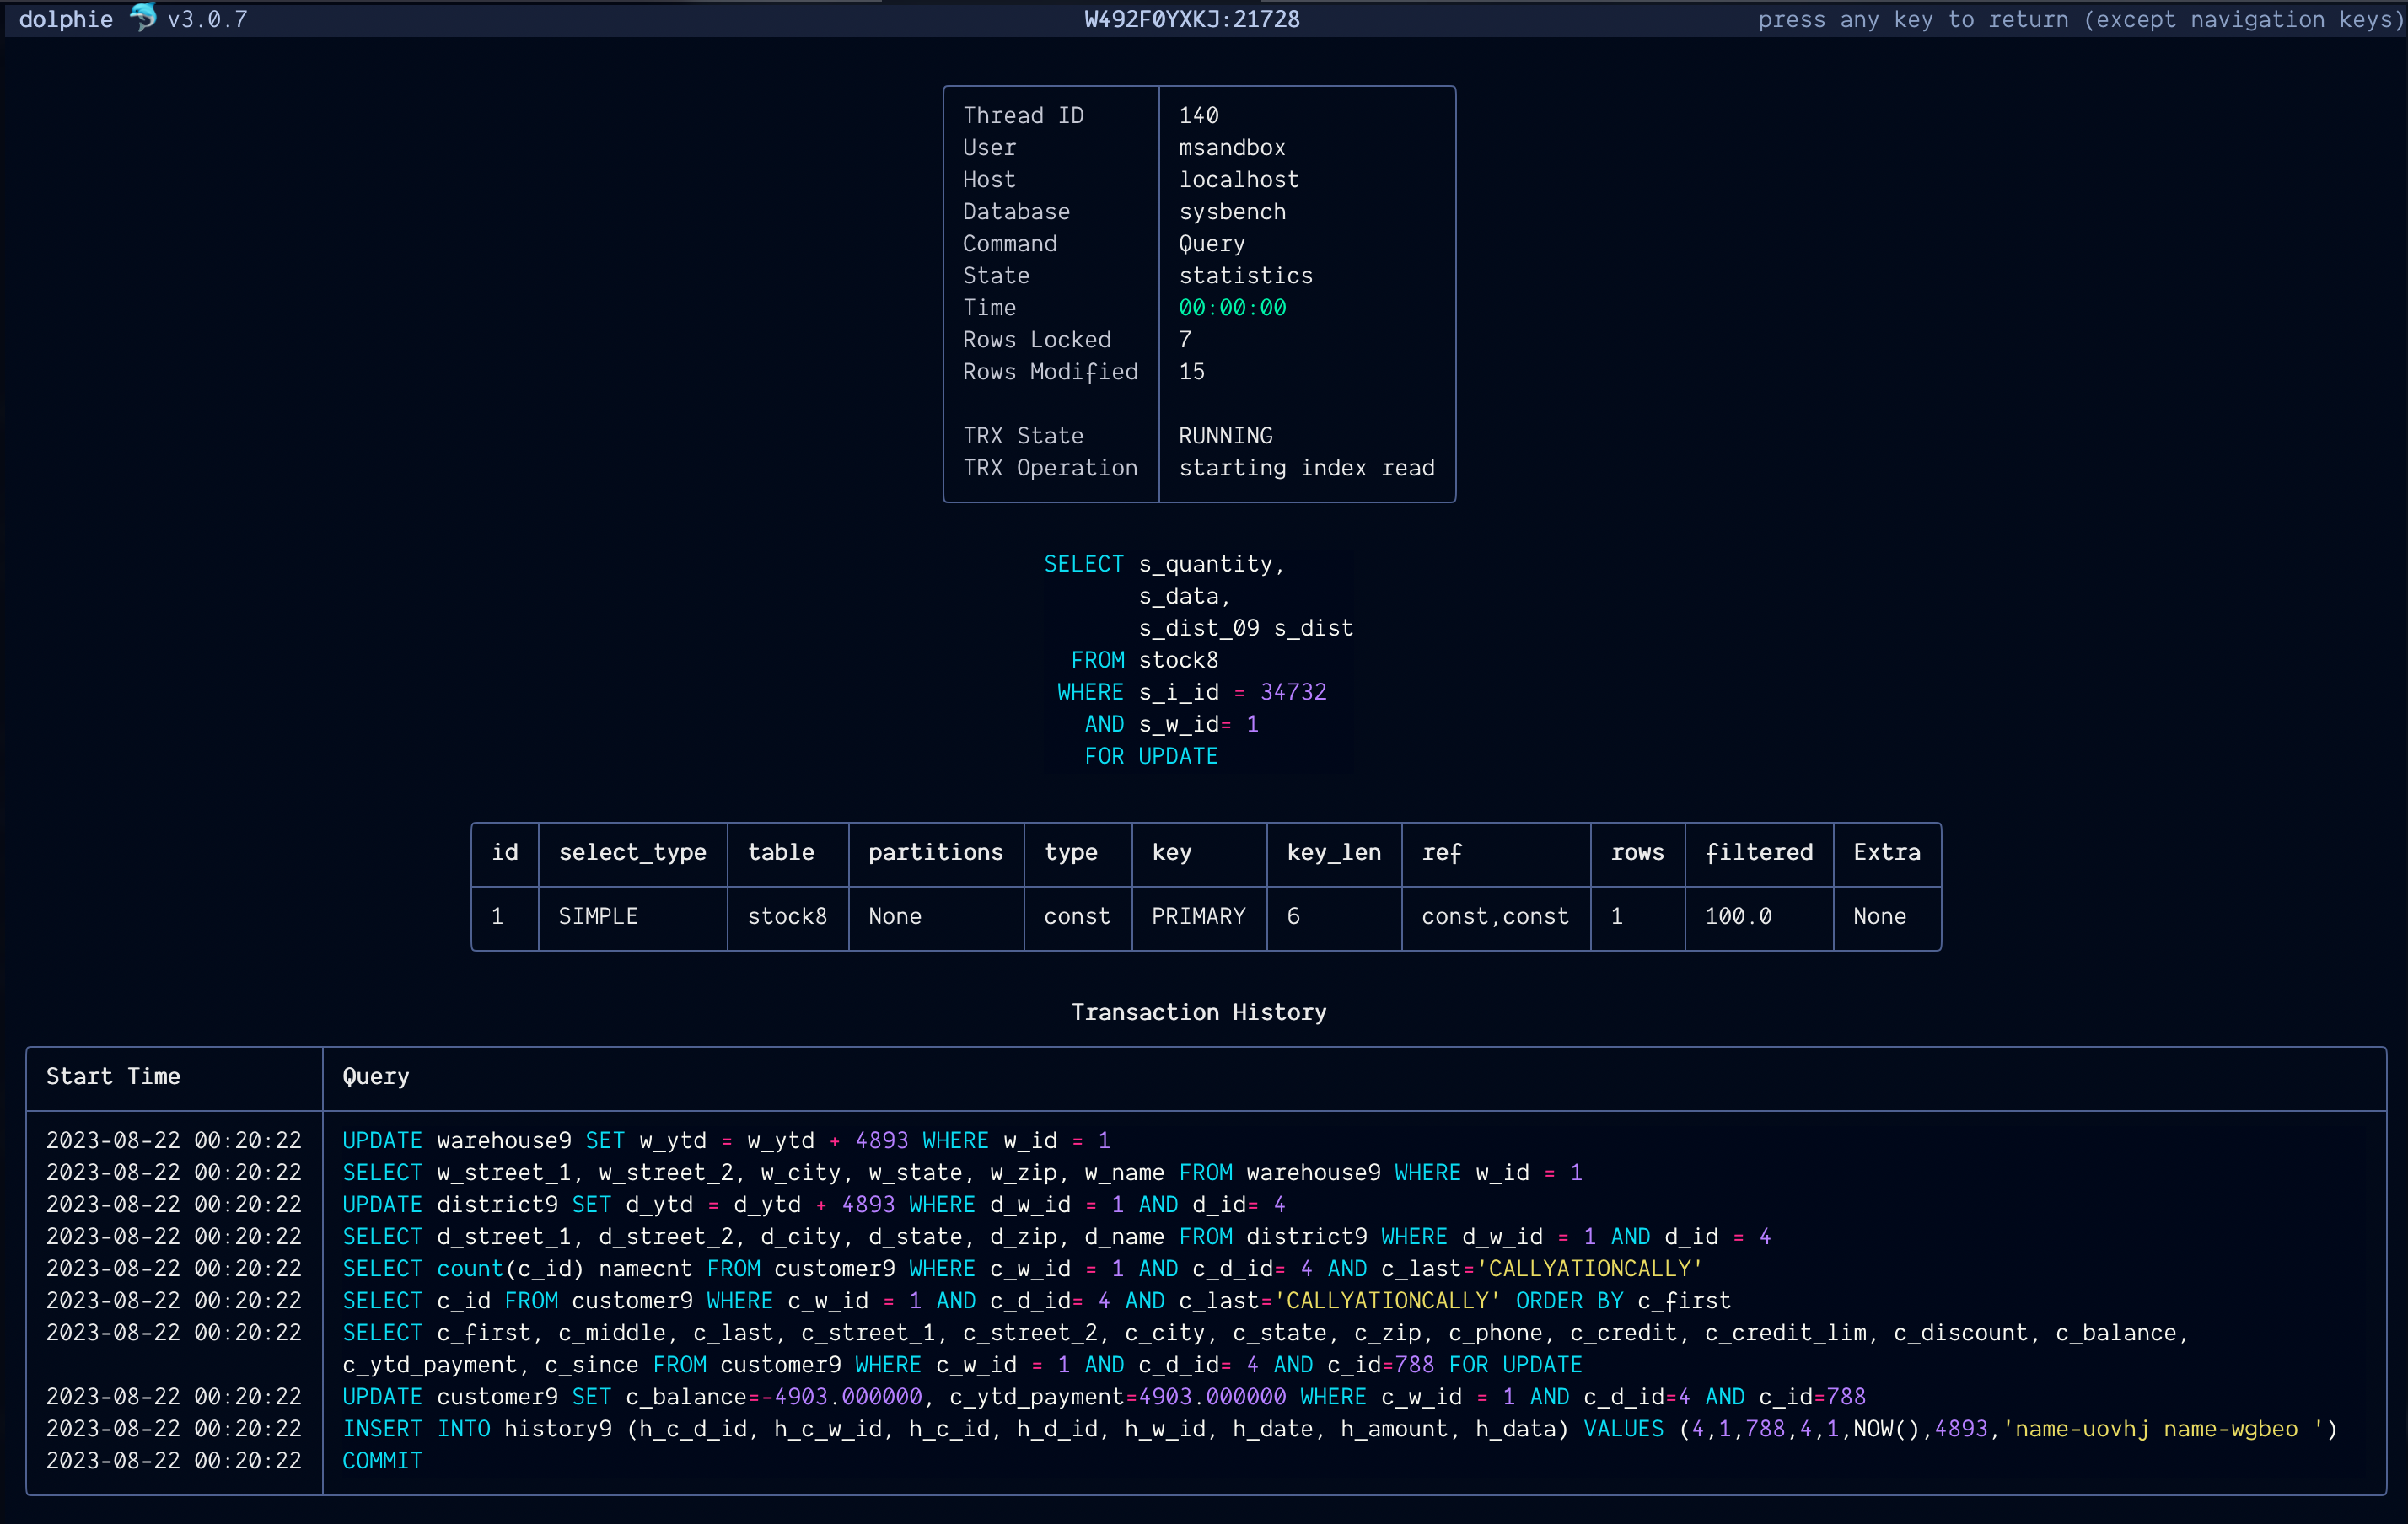
Kill threads
Dolphie lets you terminate threads using a selected option. Notice how it autocompletes the input for you. This is a feature across the board. It will autocomplete any input that it can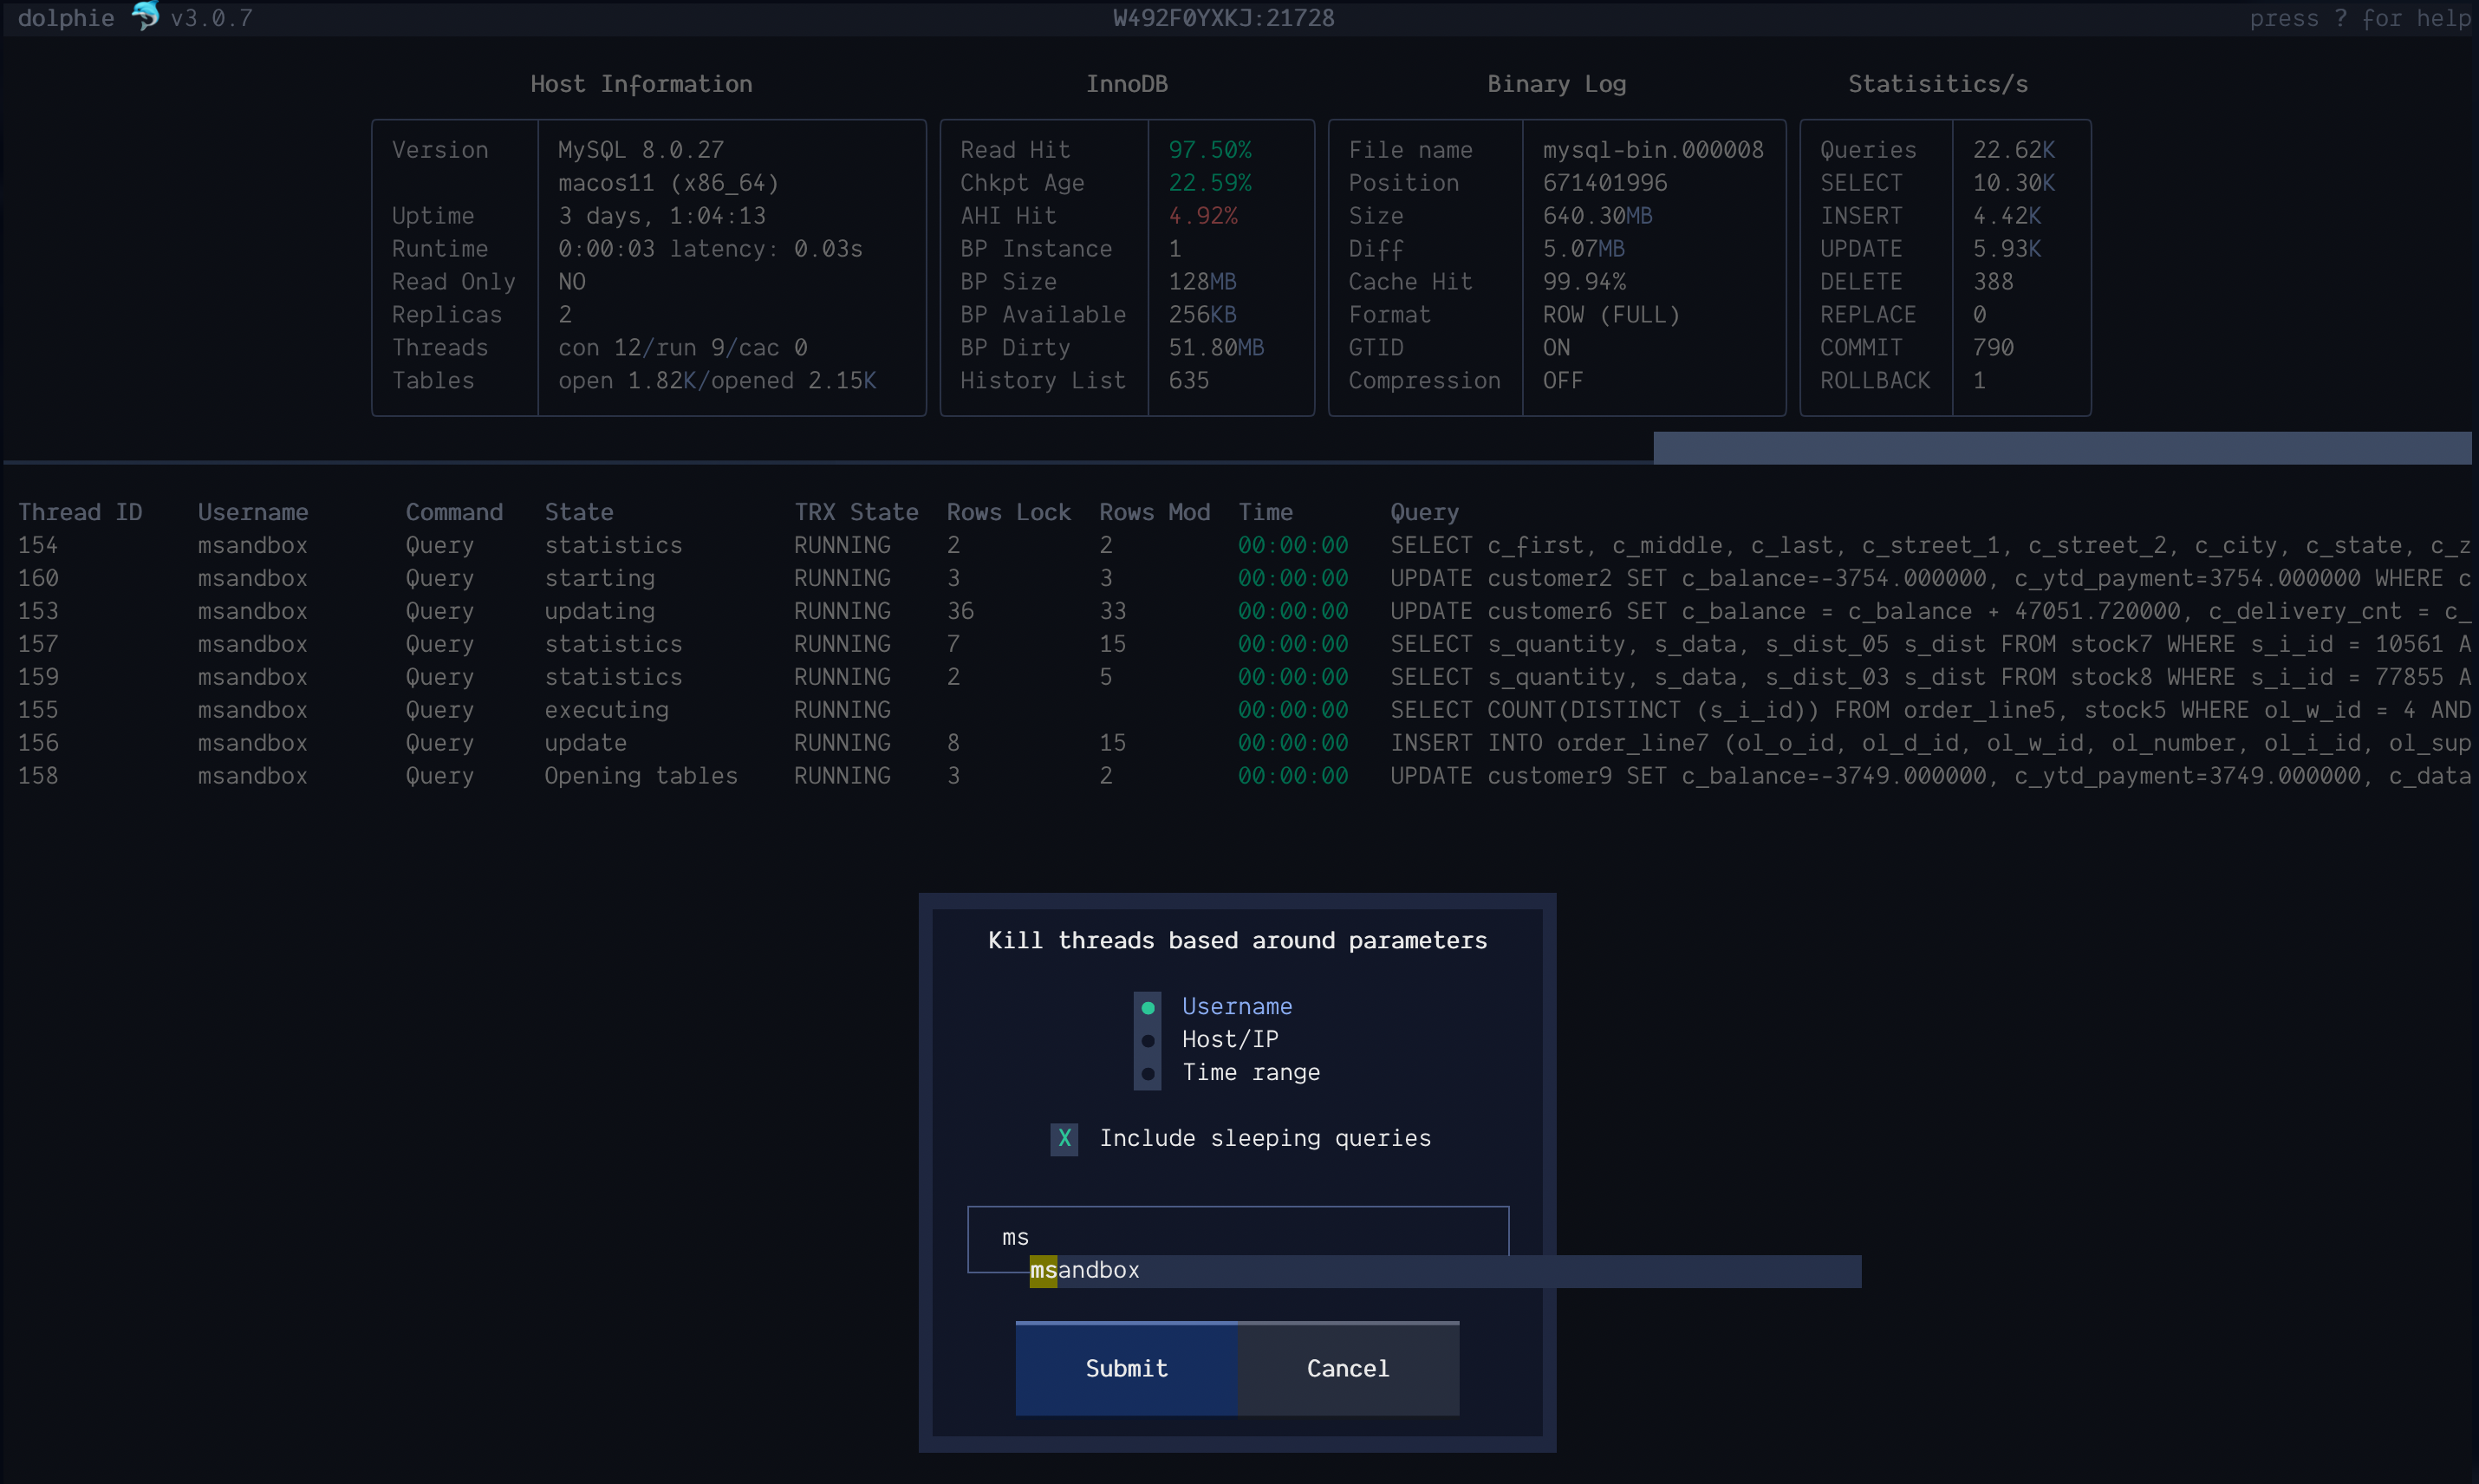
Quick switch host
After using Dolphie extensively myself, I realized the need to simplify host switching. I found myself restarting it frequently just to change the host. This feature saves all the hosts you’ve connected to, allowing for autocomplete when you want to switch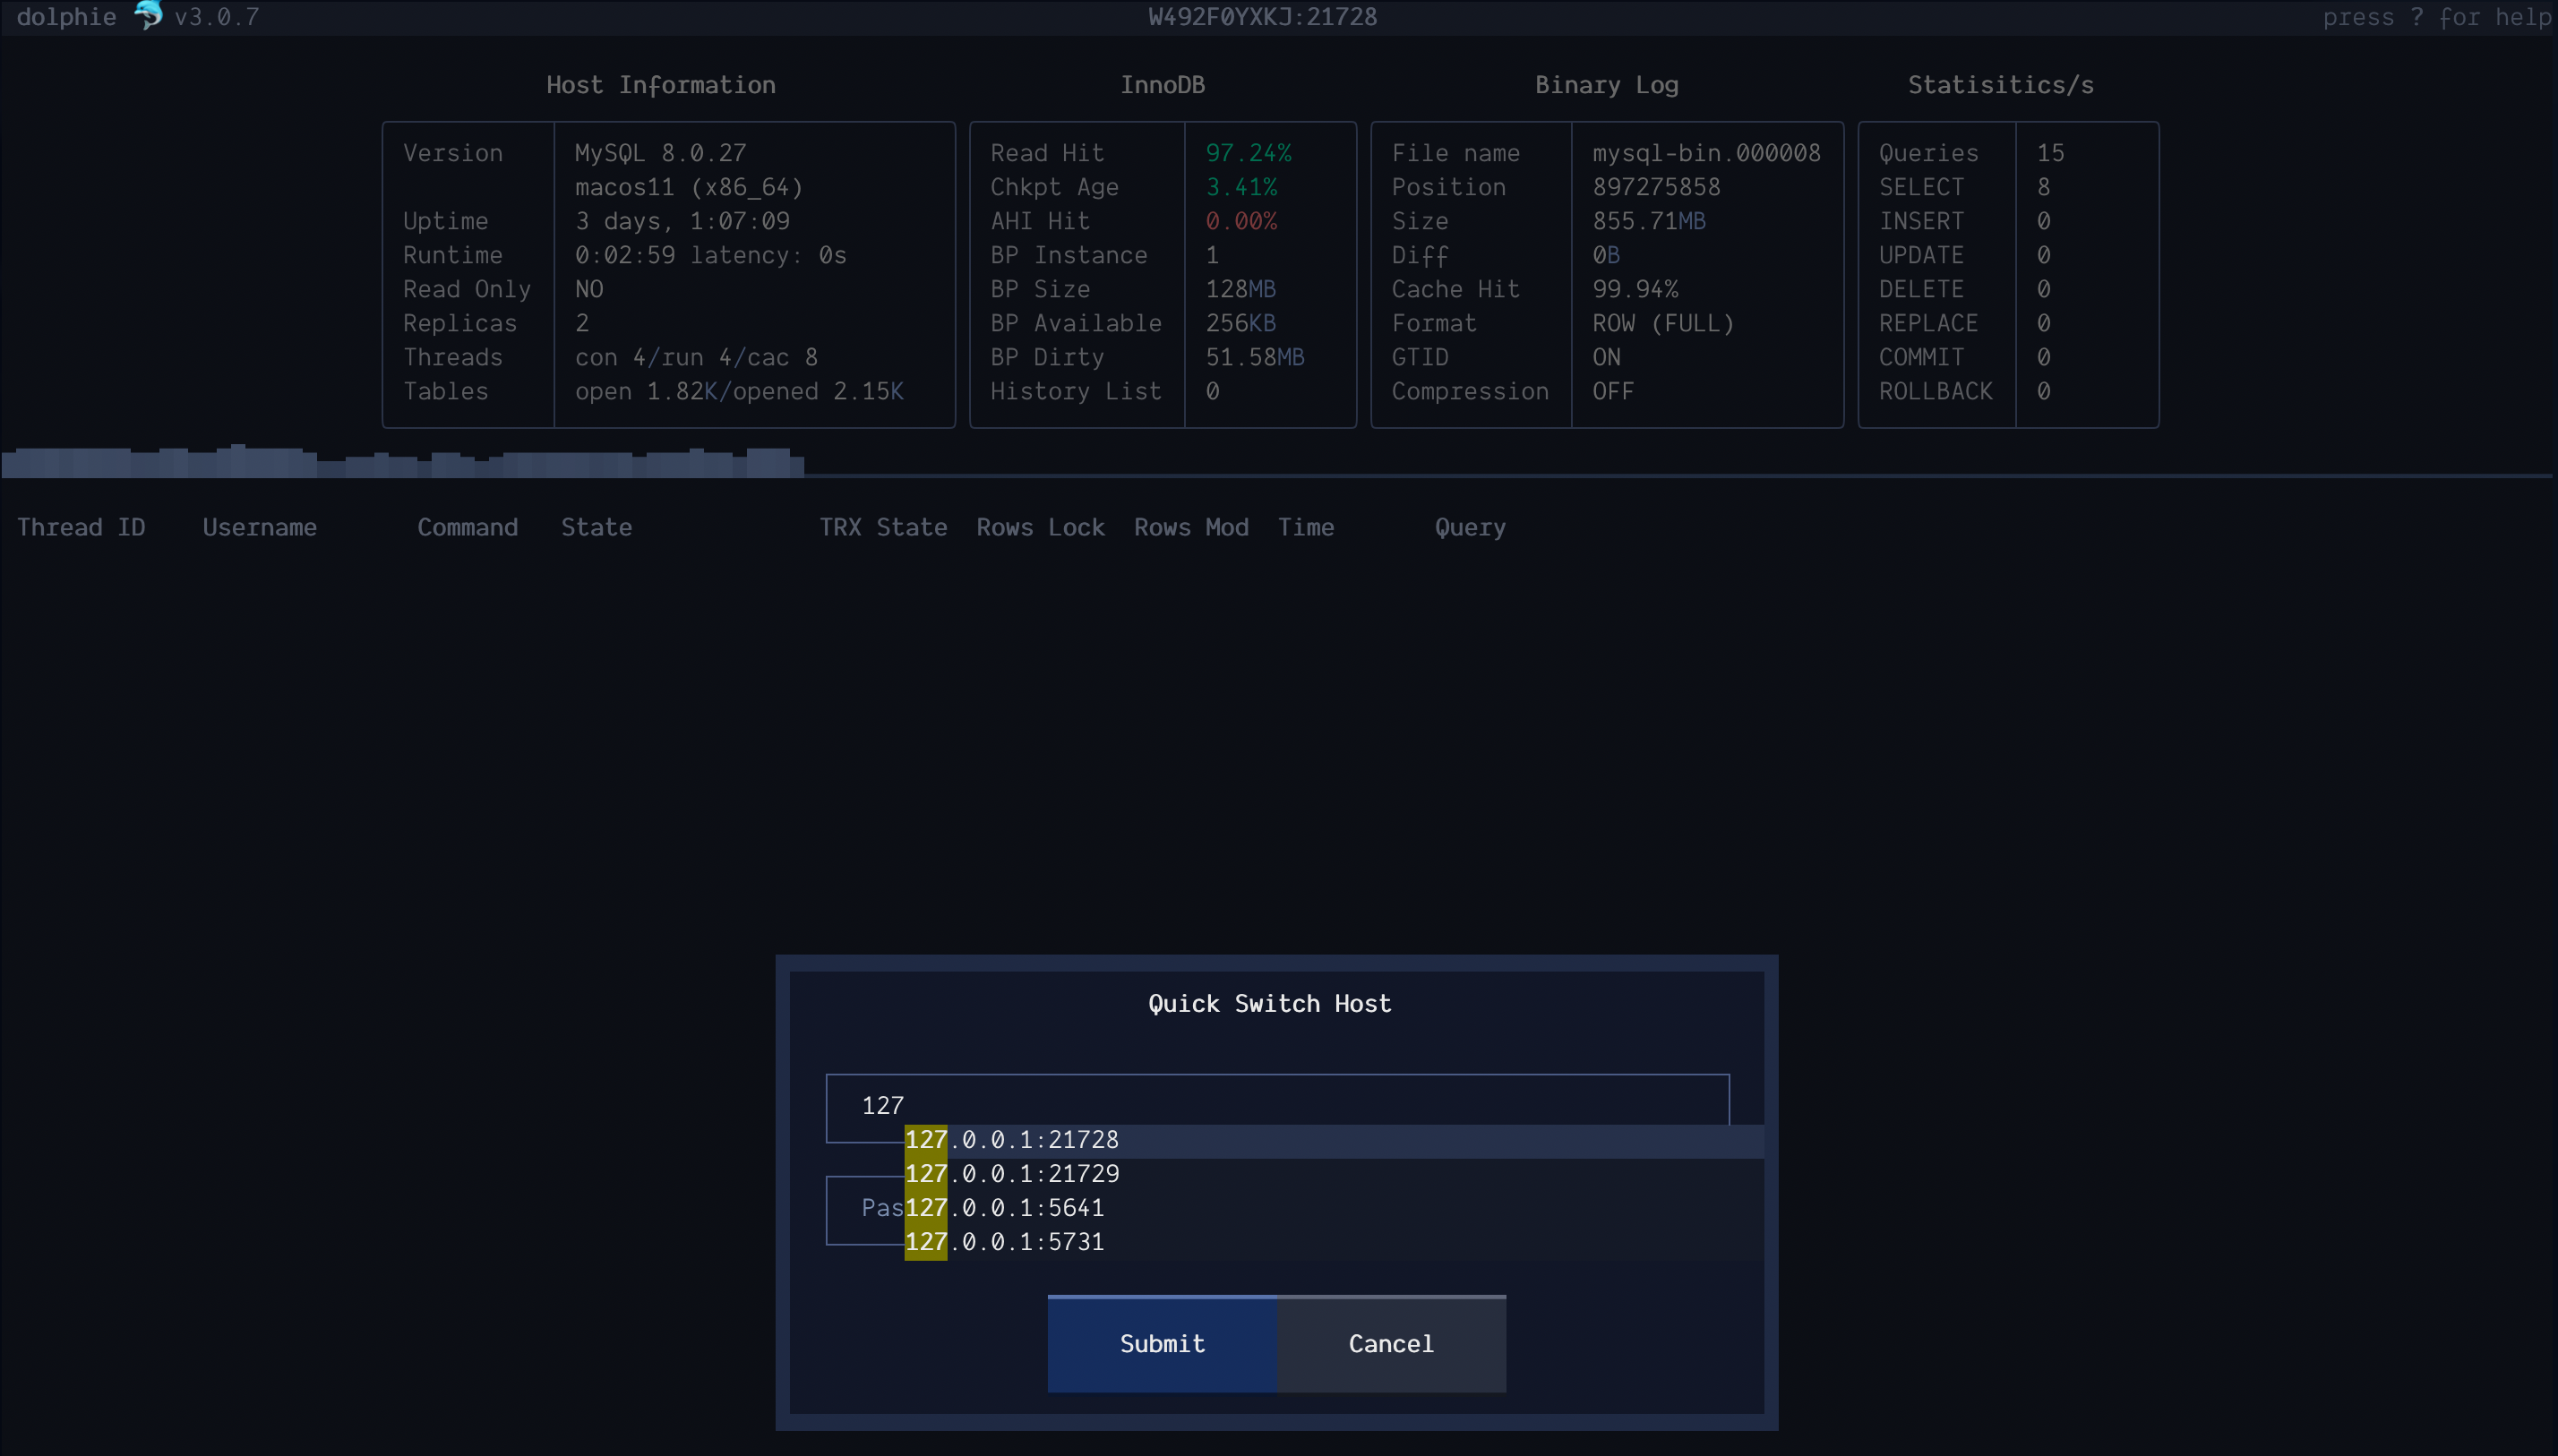
Error log
In MySQL 8, I was delighted to see that the error log was in performance_schema. Of course, I had to support it! It has switches to toggle on/off event types and search functionality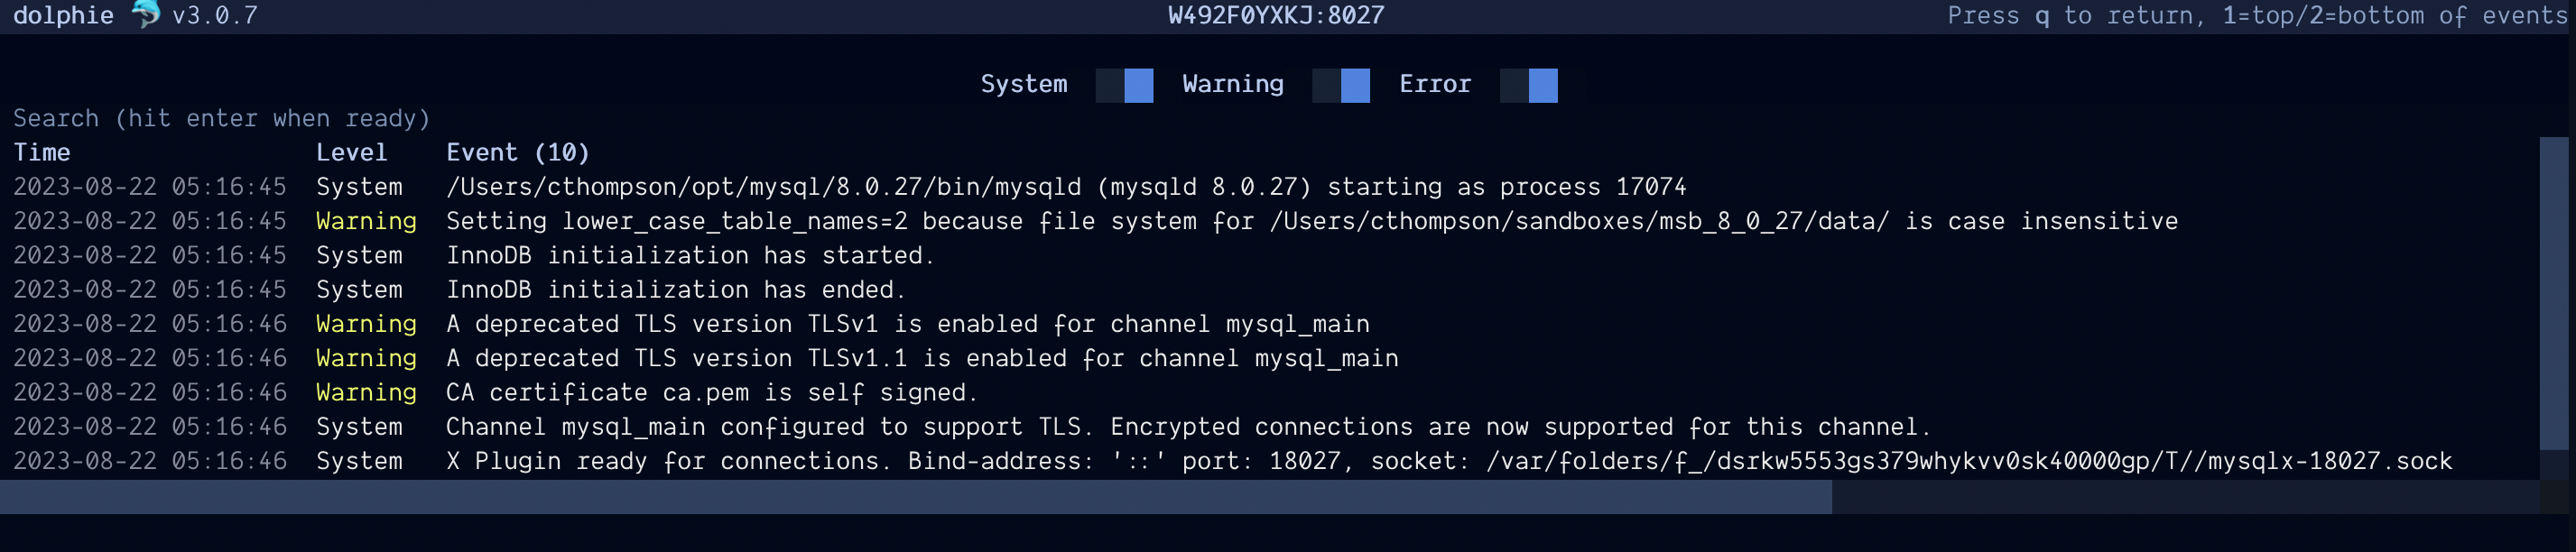
Errant transactions
The Replicas panel will let you know if your replicas have any errant transactions and what they are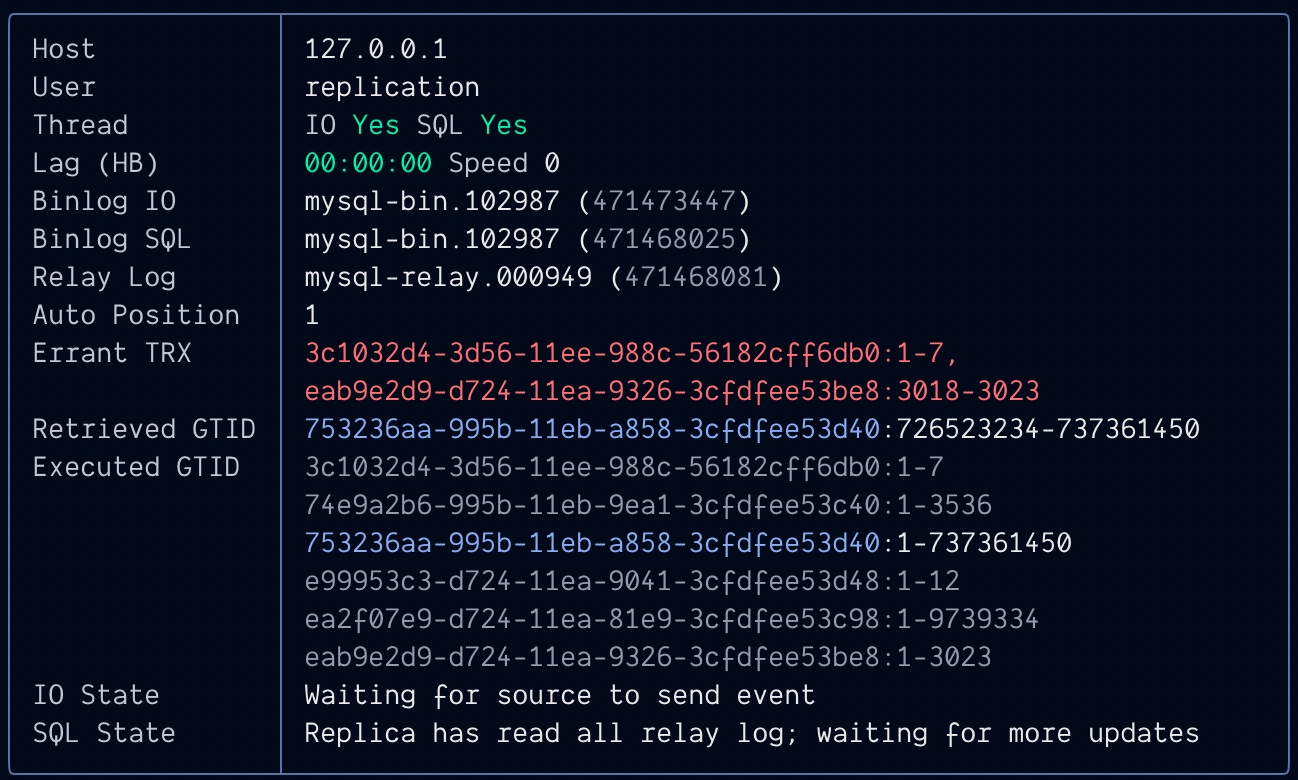
These are just some of the features that Dolphie has. There are many more that I haven’t covered, which you can discover for yourself and try out!
If you’d like to try Dolphie, it’s just a pip away:
pip install dolphieI’m open to feedback and suggestions so don’t be a stranger :) If you’d like to contribute to the project, I’d be delighted to have you!
You can find Dolphie on its GitHub ∎

Discussion
We invite you to our forum for discussion. You are welcome to use the widget below.