%22%3E%3Cpath%20d=%22M352.016%20109.322h-18.62v33.317H308.887V31.542h45.54c26.587.0%2042.669%2015.7006%2042.669%2038.4065V70.2514c0%2025.715-20.051%2039.0416-45.051%2039.0416L352.016%20109.322v0zm20.207-38.885C372.223%2059.4847%20364.589%2053.6128%20352.32%2053.6128H333.367V87.5641H352.78c12.27.0%2019.414-7.3081%2019.414-16.8242V70.437H372.223z%22%20fill=%22%23fff%22/%3E%3Cpath%20d=%22M410.776%20142.648V31.542H494.84V53.3001H435.139V75.8497h52.527V97.6078H435.139V120.949h60.494v21.758H410.776V142.648v0z%22%20fill=%22%23fff%22/%3E%3Cpath%20d=%22M582.46%20142.648%20558.588%20107.104H539.331v35.544H514.822V31.542h50.939c26.284.0%2042.032%2013.815%2042.032%2036.6674V68.5123c0%2017.9282-9.702%2029.2128-23.872%2034.4497L611.145%20142.639H582.451L582.46%20142.648zM582.95%2069.4893C582.95%2059.0255%20575.62%2053.603%20563.694%2053.603H539.341V85.5026h24.843C576.12%2085.5026%20582.95%2079.1422%20582.95%2069.8019V69.4991%2069.4893z%22%20fill=%22%23fff%22/%3E%3Cpath%20d=%22M678.058%20145.618c-33.221.0-57.907-25.568-57.907-57.9171V87.3882C620.151%2055.3812%20644.337%2029.1678%20679.048%2029.1678c21.285.0%2034.055%207.0639%2044.54%2017.3616L707.781%2064.6922C699.059%2056.7979%20690.21%2051.9909%20678.891%2051.9909c-19.021.0-32.761%2015.7593-32.761%2035.0652V87.3687c0%2019.3063%2013.397%2035.3683%2032.761%2035.3683C691.788%20122.737%20699.706%20117.588%20708.585%20109.537l15.807%2015.916C712.76%20137.851%20699.863%20145.56%20678.088%20145.56L678.058%20145.618z%22%20fill=%22%23fff%22/%3E%3Cpath%20d=%22M789.963%20145.618c-34.858.0-59.858-25.9-59.858-57.9171V87.3882c0-32.007%2025.333-58.2204%2060.162-58.2204%2034.829.0%2059.858%2025.9007%2059.858%2057.9176V87.398c0%2032.007-25.333%2058.22-60.162%2058.22zm34.212-58.22C824.175%2068.0922%20809.975%2052.03%20789.963%2052.03%20769.952%2052.03%20756.095%2067.7893%20756.095%2087.0951V87.4078C756.095%20106.714%20770.295%20122.776%20790.306%20122.776%20810.318%20122.776%20824.175%20107.017%20824.175%2087.7107V87.398v0z%22%20fill=%22%23fff%22/%3E%3Cpath%20d=%22M985.089%20142.736%201039.93%2029.1678%201094.77%20142.746h-27.5L1039.93%2086.2256l-27.24%2056.5204H985.089V142.736z%22%20fill=%22%23fff%22/%3E%3Cpath%20d=%22M974.936%2031.5811V145.628L891.304%2078.0968V142.551H865.285V29.1678L948.917%2096.4354V31.5811h26.019z%22%20fill=%22%23fff%22/%3E%3C/g%3E%3Cpath%20d=%22M219.315%20146.829c28.718-18.788%2038.114-57.1102%2020.735-87.2301-8.708-15.108-22.784-25.9277-39.624-30.4456-15.602-4.1923-31.898-2.478-46.241%204.7743L134.603.0%2093.9541%2070.4613.0%20233.311H269.206l-49.891-86.482zM195.821%2046.4134c12.241%203.263%2022.427%2011.1294%2028.771%2022.0826%2012.47%2021.5912%205.993%2048.977-14.23%2062.808L163.128%2049.4361c10.176-4.8971%2021.653-5.9652%2032.693-3.0227zM134.603%2035.7593%20238.247%20215.426H177.605L104.268%2088.3409l30.329-52.5762L134.603%2035.7593zM30.9588%20215.426l62.99-109.168L156.939%20215.426H30.9588z%22%20fill=%22url(%23paint0_linear_1391_11470)%22/%3E%3Cpath%20d=%22M306.655%20202.335C306.655%20196.555%20307.958%20191.37%20310.565%20186.78%20313.172%20182.133%20316.713%20178.507%20321.19%20175.9%20325.723%20173.293%20330.738%20171.99%20336.235%20171.99%20342.695%20171.99%20348.333%20173.548%20353.15%20176.665%20357.967%20179.782%20361.48%20184.202%20363.69%20189.925H354.425C352.782%20186.355%20350.402%20183.607%20347.285%20181.68%20344.225%20179.753%20340.542%20178.79%20336.235%20178.79%20332.098%20178.79%20328.387%20179.753%20325.1%20181.68%20321.813%20183.607%20319.235%20186.355%20317.365%20189.925%20315.495%20193.438%20314.56%20197.575%20314.56%20202.335%20314.56%20207.038%20315.495%20211.175%20317.365%20214.745%20319.235%20218.258%20321.813%20220.978%20325.1%20222.905%20328.387%20224.832%20332.098%20225.795%20336.235%20225.795%20340.542%20225.795%20344.225%20224.86%20347.285%20222.99%20350.402%20221.063%20352.782%20218.315%20354.425%20214.745H363.69C361.48%20220.412%20357.967%20224.803%20353.15%20227.92%20348.333%20230.98%20342.695%20232.51%20336.235%20232.51%20330.738%20232.51%20325.723%20231.235%20321.19%20228.685%20316.713%20226.078%20313.172%20222.48%20310.565%20217.89%20307.958%20213.3%20306.655%20208.115%20306.655%20202.335zm130.259%2030.26C431.418%20232.595%20426.403%20231.32%20421.869%20228.77%20417.336%20226.163%20413.738%20222.565%20411.074%20217.975%20408.468%20213.328%20407.164%20208.115%20407.164%20202.335S408.468%20191.37%20411.074%20186.78C413.738%20182.133%20417.336%20178.535%20421.869%20175.985%20426.403%20173.378%20431.418%20172.075%20436.914%20172.075%20442.468%20172.075%20447.511%20173.378%20452.044%20175.985%20456.578%20178.535%20460.148%20182.105%20462.754%20186.695%20465.361%20191.285%20466.664%20196.498%20466.664%20202.335%20466.664%20208.172%20465.361%20213.385%20462.754%20217.975%20460.148%20222.565%20456.578%20226.163%20452.044%20228.77%20447.511%20231.32%20442.468%20232.595%20436.914%20232.595zm0-6.715C441.051%20225.88%20444.763%20224.917%20448.049%20222.99%20451.393%20221.063%20453.999%20218.315%20455.869%20214.745%20457.796%20211.175%20458.759%20207.038%20458.759%20202.335%20458.759%20197.575%20457.796%20193.438%20455.869%20189.925%20453.999%20186.355%20451.421%20183.607%20448.134%20181.68%20444.848%20179.753%20441.108%20178.79%20436.914%20178.79%20432.721%20178.79%20428.981%20179.753%20425.694%20181.68%20422.408%20183.607%20419.801%20186.355%20417.874%20189.925%20416.004%20193.438%20415.069%20197.575%20415.069%20202.335%20415.069%20207.038%20416.004%20211.175%20417.874%20214.745%20419.801%20218.315%20422.408%20221.063%20425.694%20222.99%20429.038%20224.917%20432.778%20225.88%20436.914%20225.88zm134.906-52.7V232H564.085V188.14L544.535%20232H539.095L519.46%20188.055V232H511.725V173.18H520.055L541.815%20221.8l21.76-48.62H571.82zm108.063.0V232H672.148V188.14L652.598%20232H647.158l-19.635-43.945V232H619.788V173.18H628.118l21.76%2048.62%2021.76-48.62H679.883zM735.416%20172.755V210.24C735.416%20215.51%20736.691%20219.42%20739.241%20221.97%20741.848%20224.52%20745.446%20225.795%20750.036%20225.795%20754.57%20225.795%20758.111%20224.52%20760.661%20221.97%20763.268%20219.42%20764.571%20215.51%20764.571%20210.24V172.755H772.306v37.4C772.306%20215.085%20771.315%20219.25%20769.331%20222.65%20767.348%20225.993%20764.656%20228.487%20761.256%20230.13%20757.913%20231.773%20754.145%20232.595%20749.951%20232.595%20745.758%20232.595%20741.961%20231.773%20738.561%20230.13%20735.218%20228.487%20732.555%20225.993%20730.571%20222.65%20728.645%20219.25%20727.681%20215.085%20727.681%20210.155v-37.4H735.416zM866.64%20232H858.905l-31.11-47.175V232H820.06V172.67H827.795l31.11%2047.09V172.67H866.64V232zm55.77-59.245V232H914.675V172.755H922.41zm84.5.0V179.045H990.758V232H983.023V179.045H966.788V172.755h40.122zm85.85.0-19.3%2036.89V232H1065.73V209.645L1046.35%20172.755H1054.93L1069.55%20202.76%201084.17%20172.755H1092.76z%22%20fill=%22%23fff%22/%3E%3Cdefs%3E%3ClinearGradient%20id=%22paint0_linear_1391_11470%22%20x1=%2230.363%22%20y1=%22238.463%22%20x2=%22230.327%22%20y2=%2238.6685%22%20gradientUnits=%22userSpaceOnUse%22%3E%3Cstop%20stop-color=%22%23FC3519%22/%3E%3Cstop%20offset=%221%22%20stop-color=%22%23F0D136%22/%3E%3C/linearGradient%3E%3CclipPath%20id=%22clip0_1391_11470%22%3E%3Crect%20width=%22962.614%22%20height=%22116.656%22%20fill=%22%23fff%22%20transform=%22translate(132.155%2028.9724)%22/%3E%3C/clipPath%3E%3C/defs%3E%3C/svg%3E)
I will tell you the real story of using database monitoring tools when developing an application. I will show you an example of how I managed to detect and fix a problem in the application.
A small clarification, the real story from my development practice happened a little more than a week ago, but for the article I took graphs of final debugging, so that the graphs show the correct sequence and fit into the available for explanation and demonstration. It’s just that in reality, I went out for coffee several times and thought for a long time about what was reflected in the graphs of monitoring:)
About the app and the process
I am developing a PHP application using MongoDB as a database. The application is lightweight, and most load falls on the database. I have implemented functions at the application level to adjust the number of queries, as the application can quickly load the database to 100%.
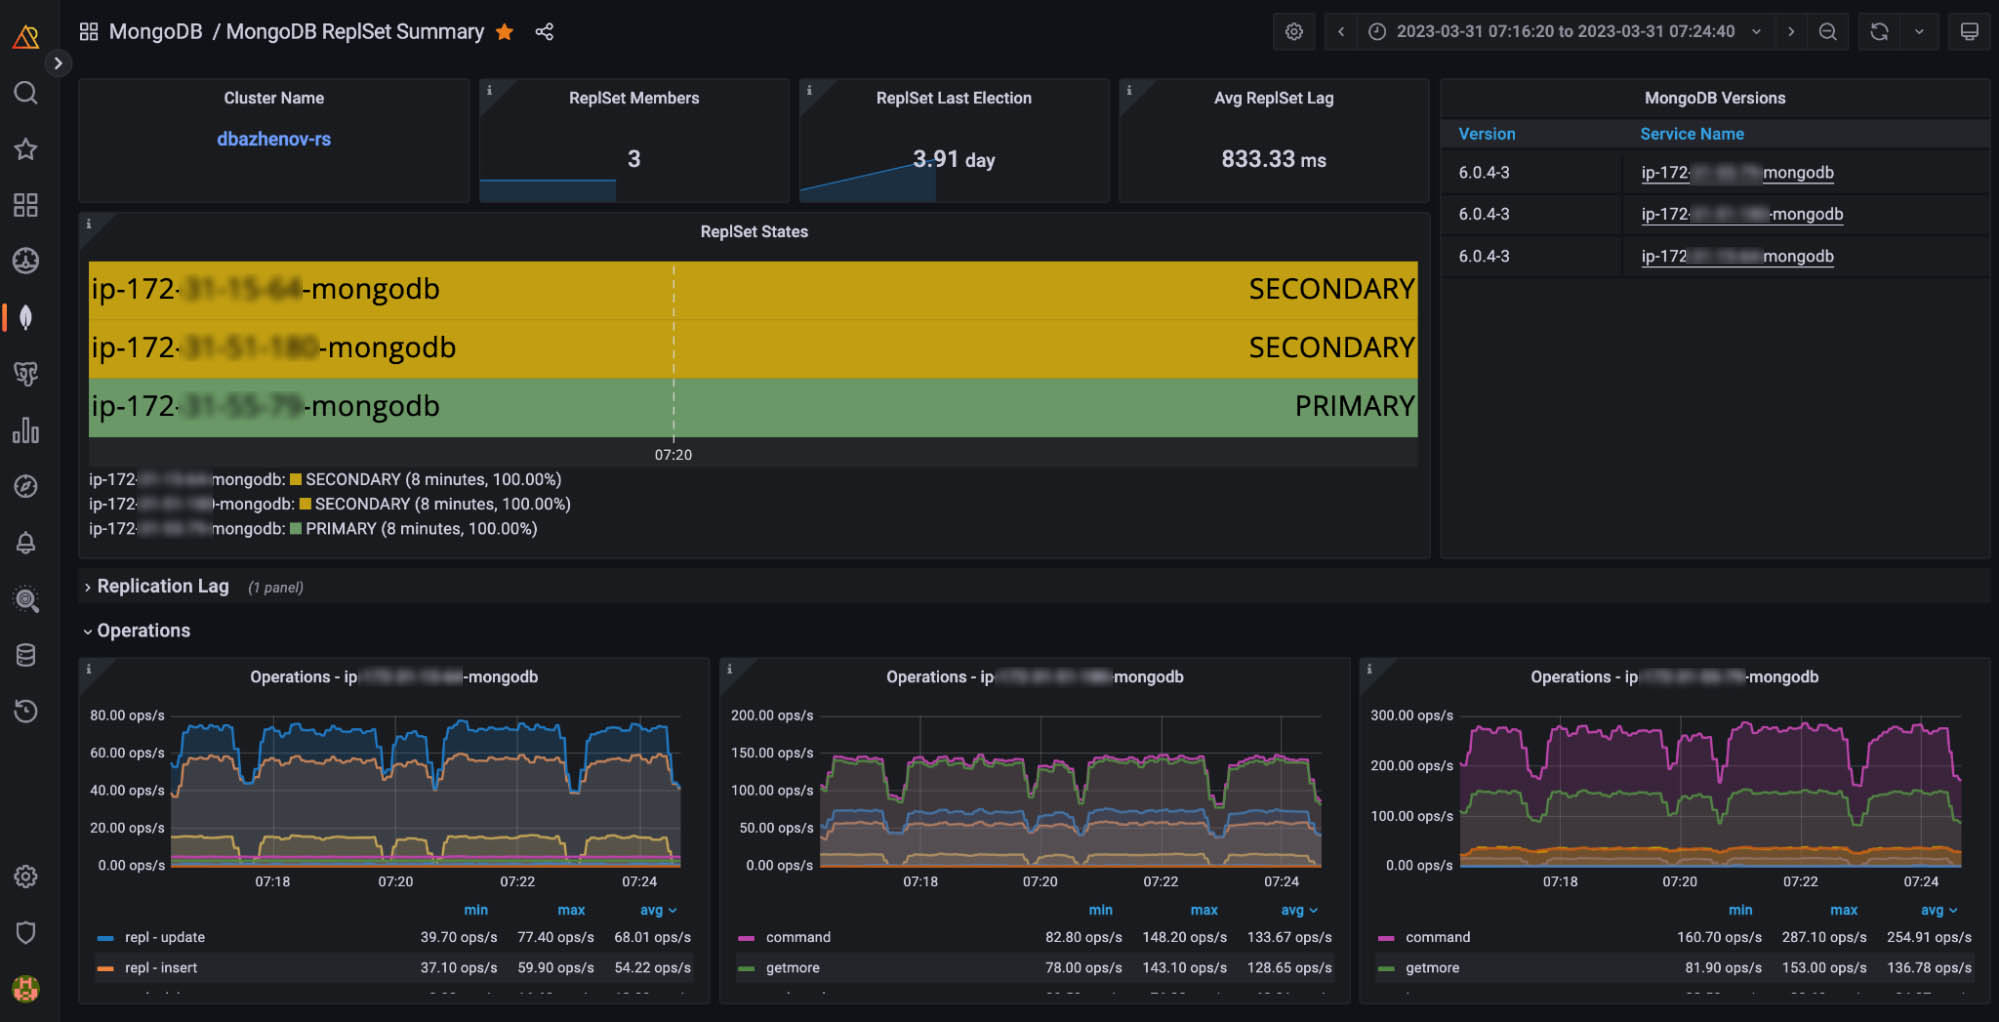
For development, I use several small dev instances in AWS, use Percona Server for MongoDB with three nodes as a database, and have Percona Monitoring and Management (PMM) installed for monitoring the databases.
My development process consists of the following steps:
- I developed a new feature and ran it on the dev server for testing.
- I check the prefiling on the PHP side, and there is no memory leak, and I am happy with the speed.
- I check the database monitoring to ensure everything works fine.
- I debug the feature, setting the number and types of queries in the function to balance the number of queries and the load on the database, if necessary.
Adding new functionality to the application
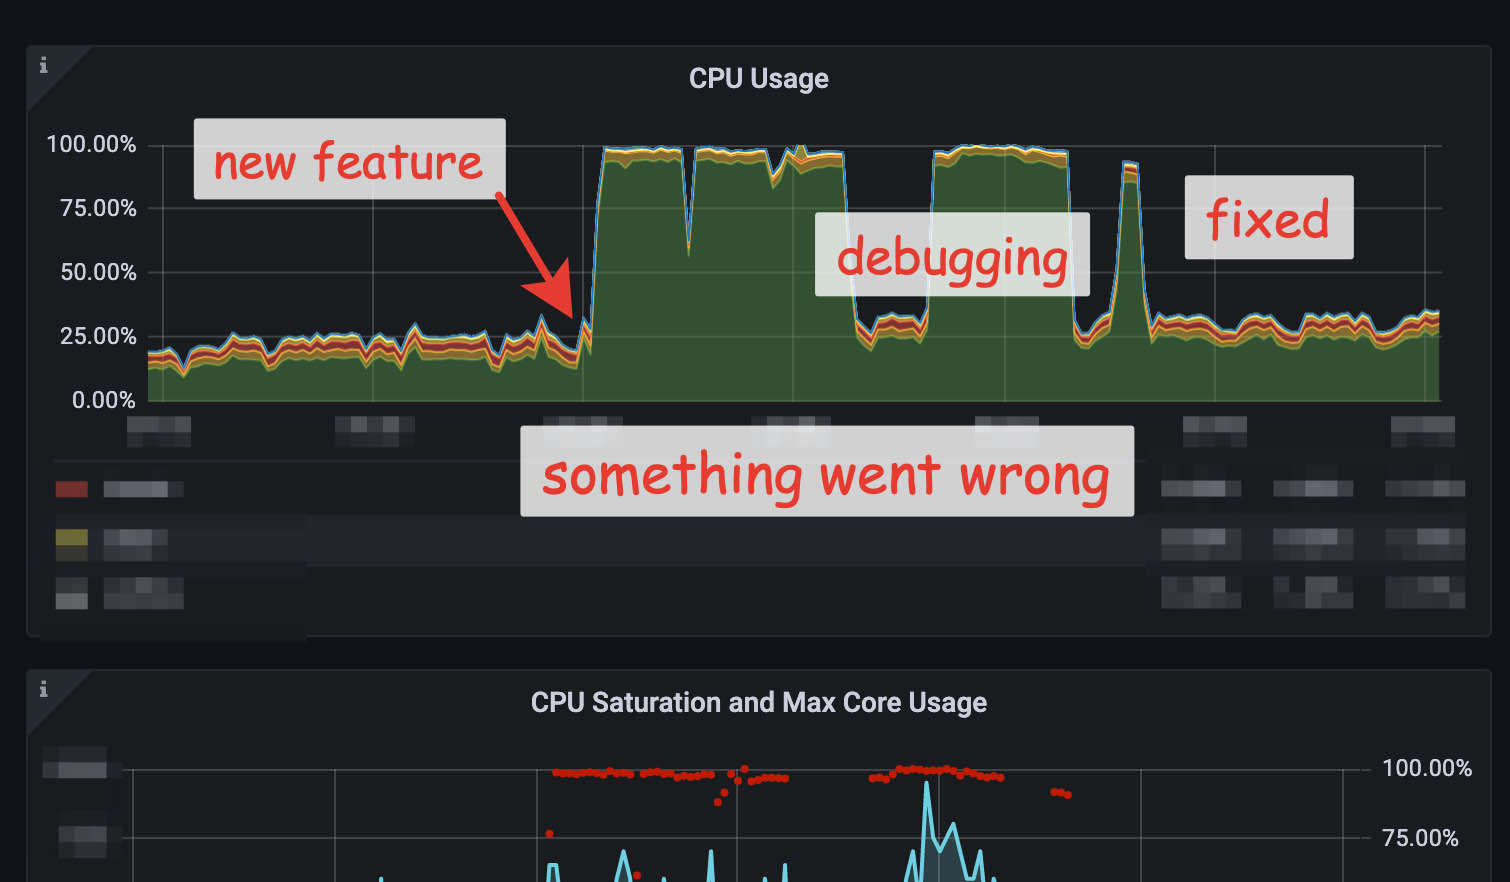
So I started the application and got ready to run the new feature. The feature was getting information from open sources, processing it, and saving it to the database. The second part of the functionality went through all the saved documents and did some additional processing.
At this point, the application already had a lot of features that loaded the CPU of the Primary Node by 25-40%, and everything was running stably. I decided to have a performance reserve, as I planned to add new features.
I checked several dashboards, and there were no anomalies or changes. PMM has many dashboards and charts, and I will only show a few, just some.
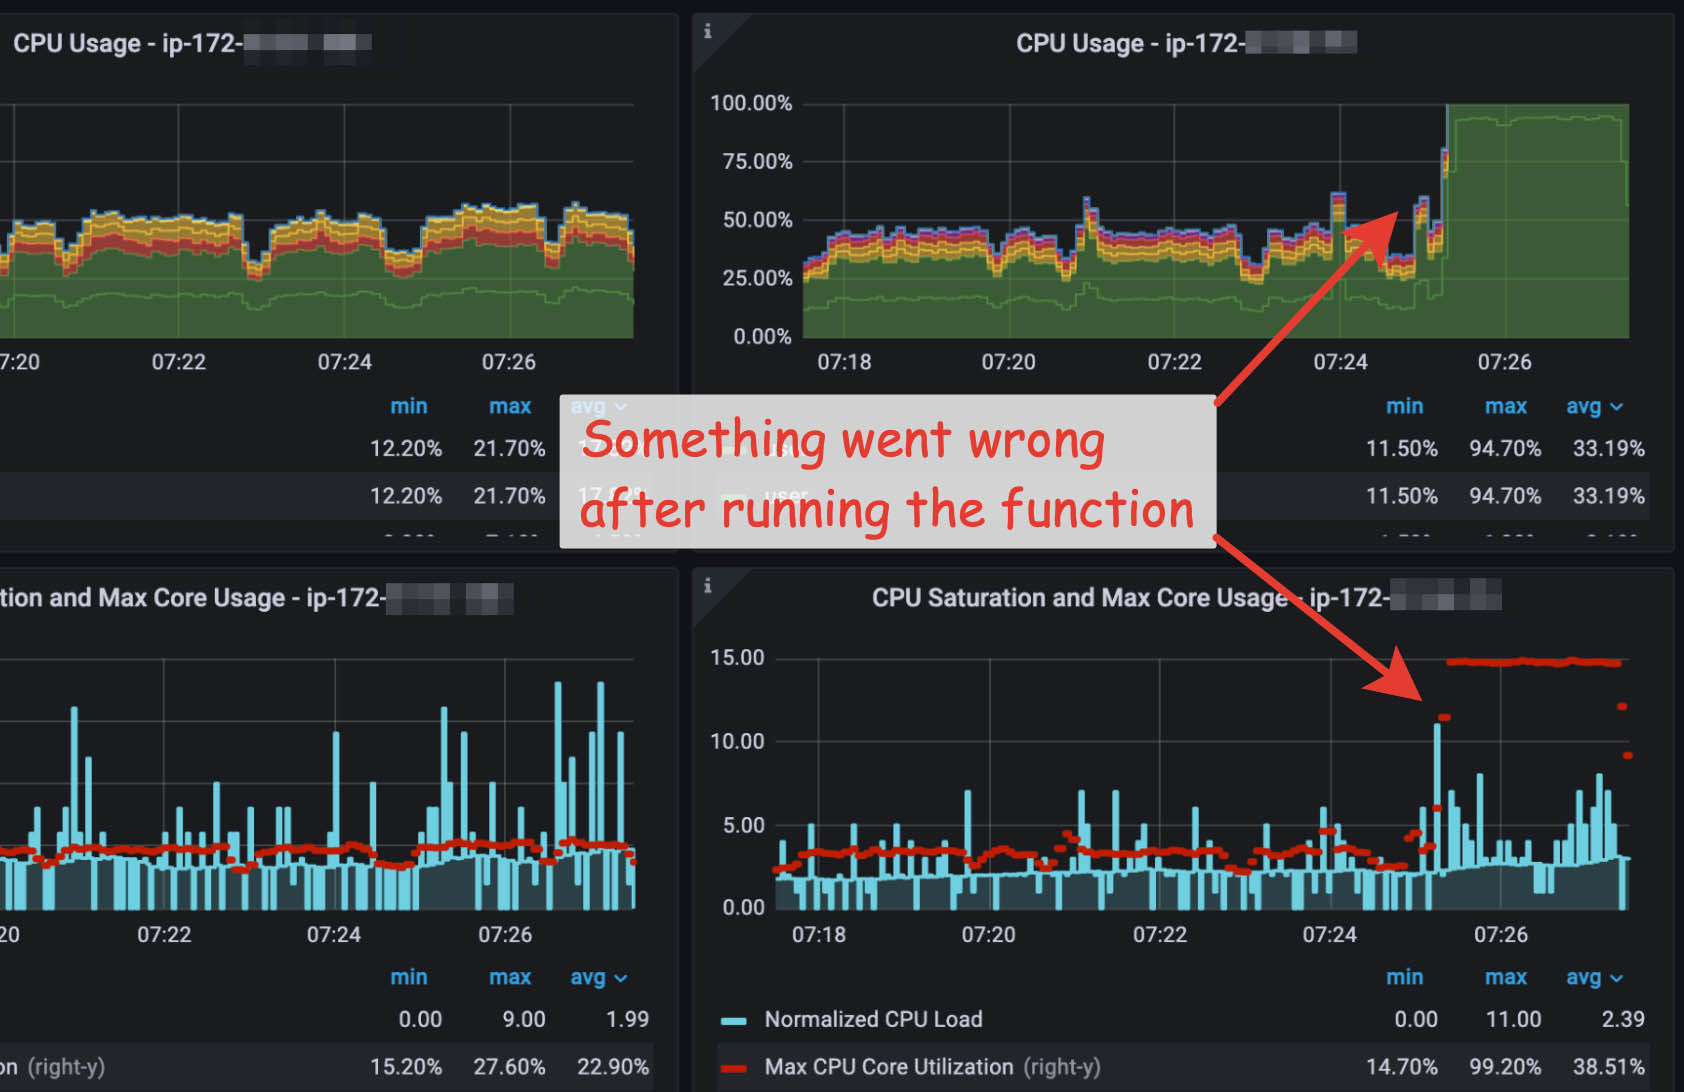
I saved the changes with the new feature and pushed it to the dev server to make it work. Then I checked that the function started without errors, and the result was visible in the database. I use MongoDB Compass to check the result of a database entry.
Something has gone differently than planned.
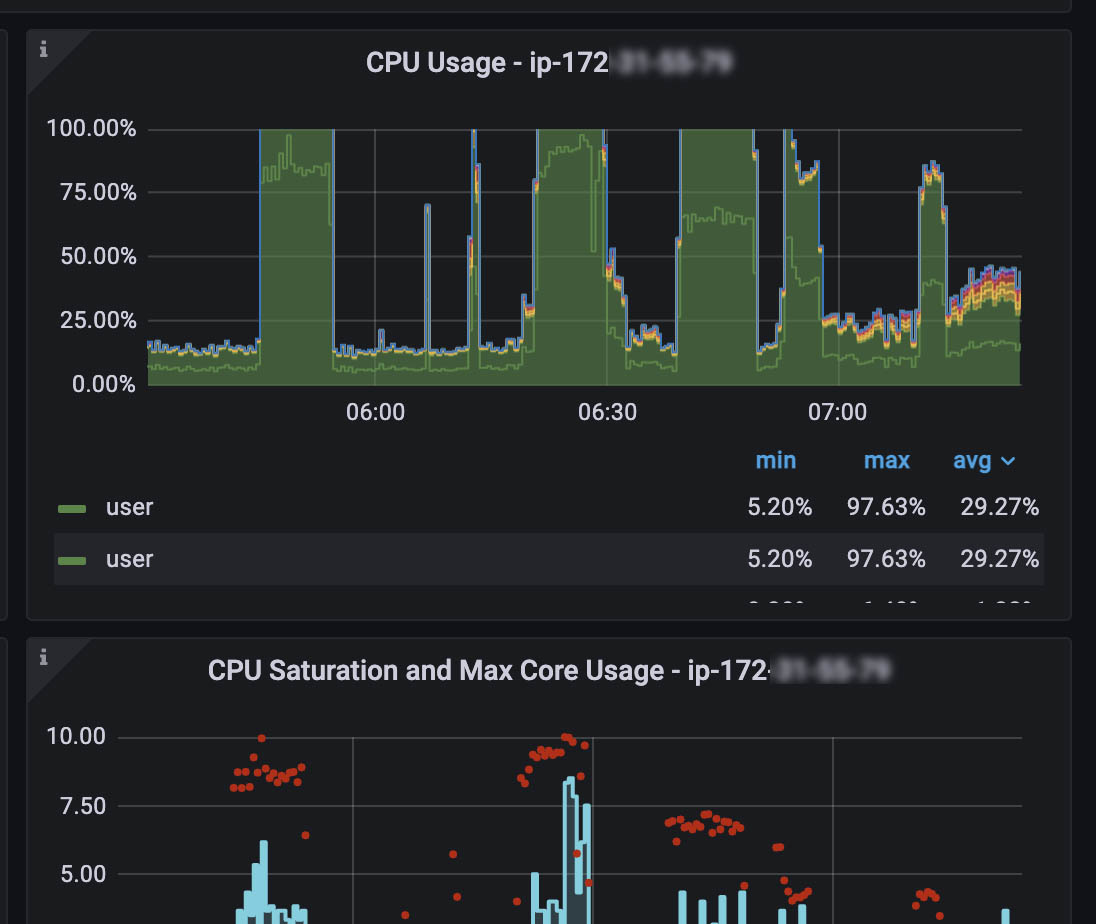
I waited a few minutes and rechecked the dashboard. At first glance, the main screen was fine. However, I was alarmed by the speed of processing. The number of operations has mostly stayed the same.
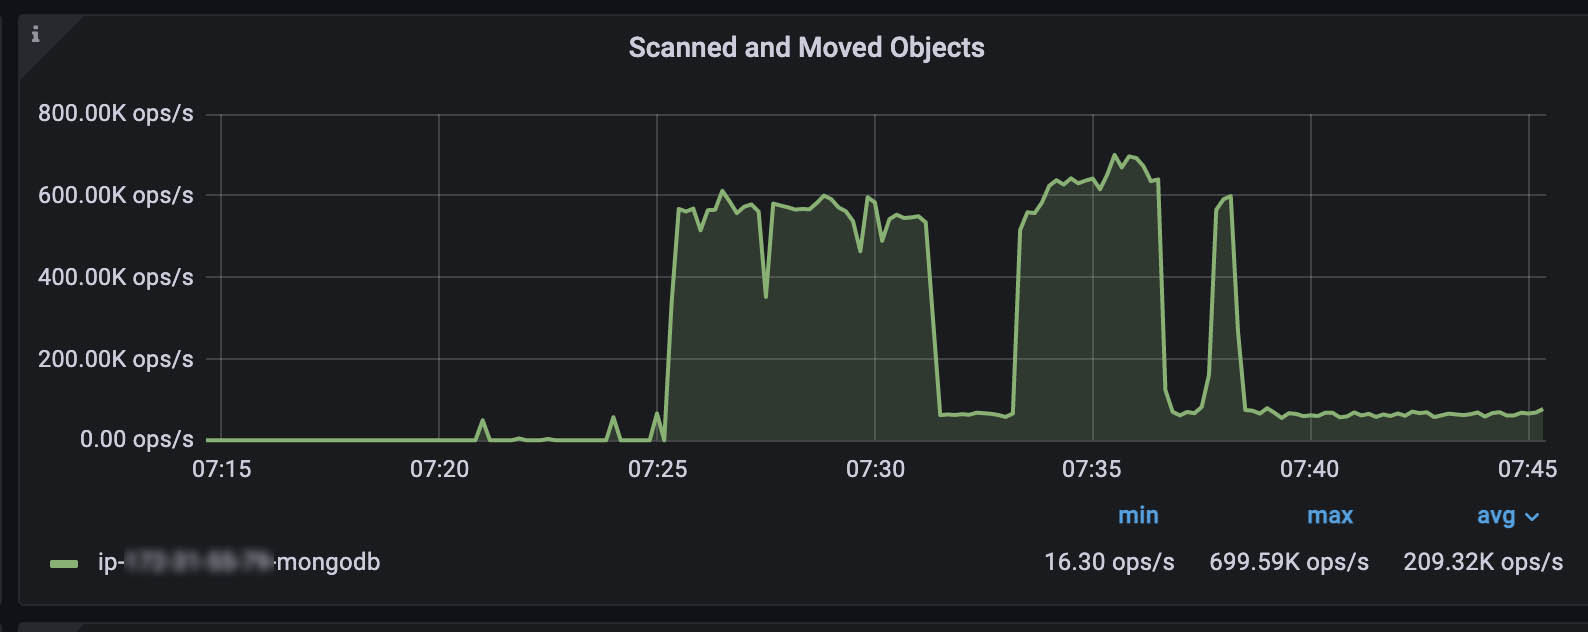
I scrolled down through the various charts on the dashboard and saw an anomaly.
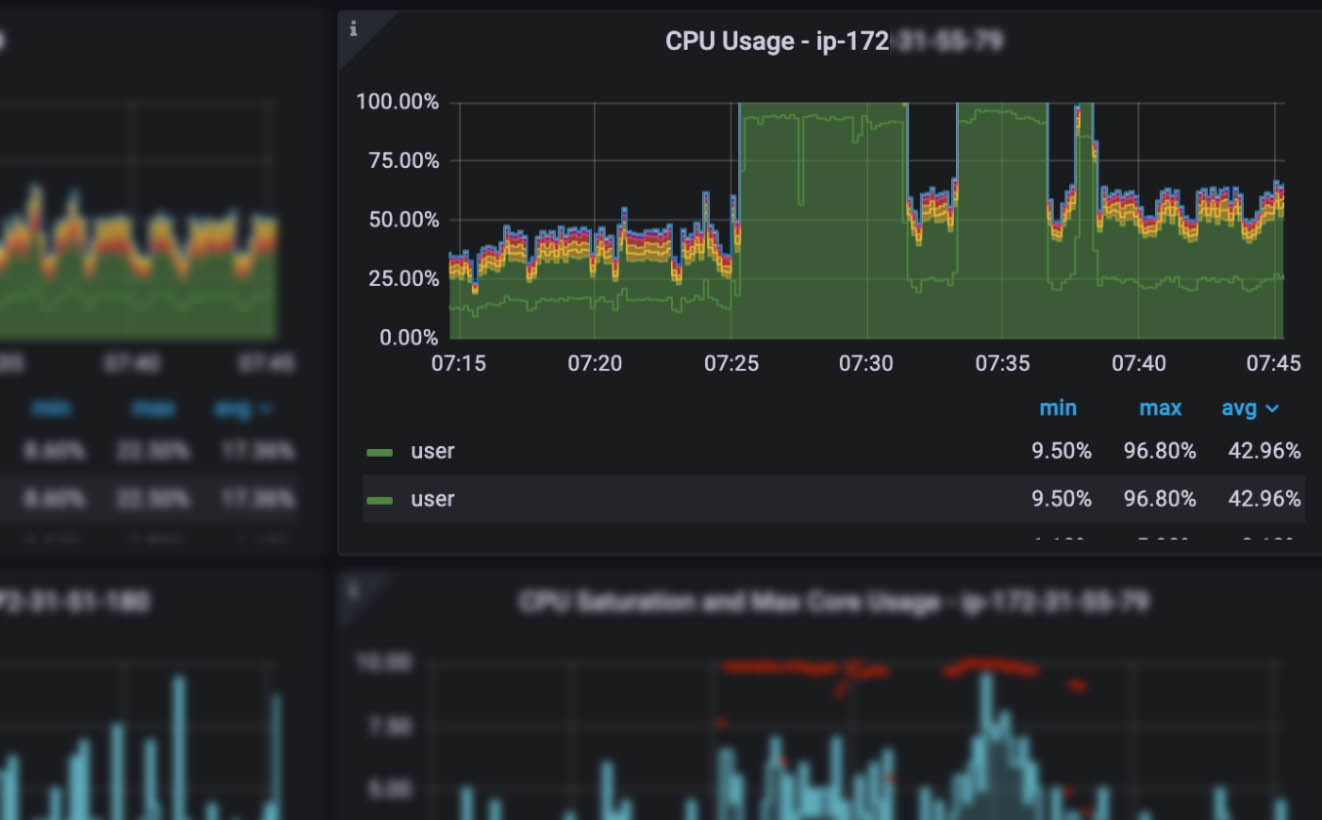
The latency increased, and the app loaded the instance to 100% CPU.
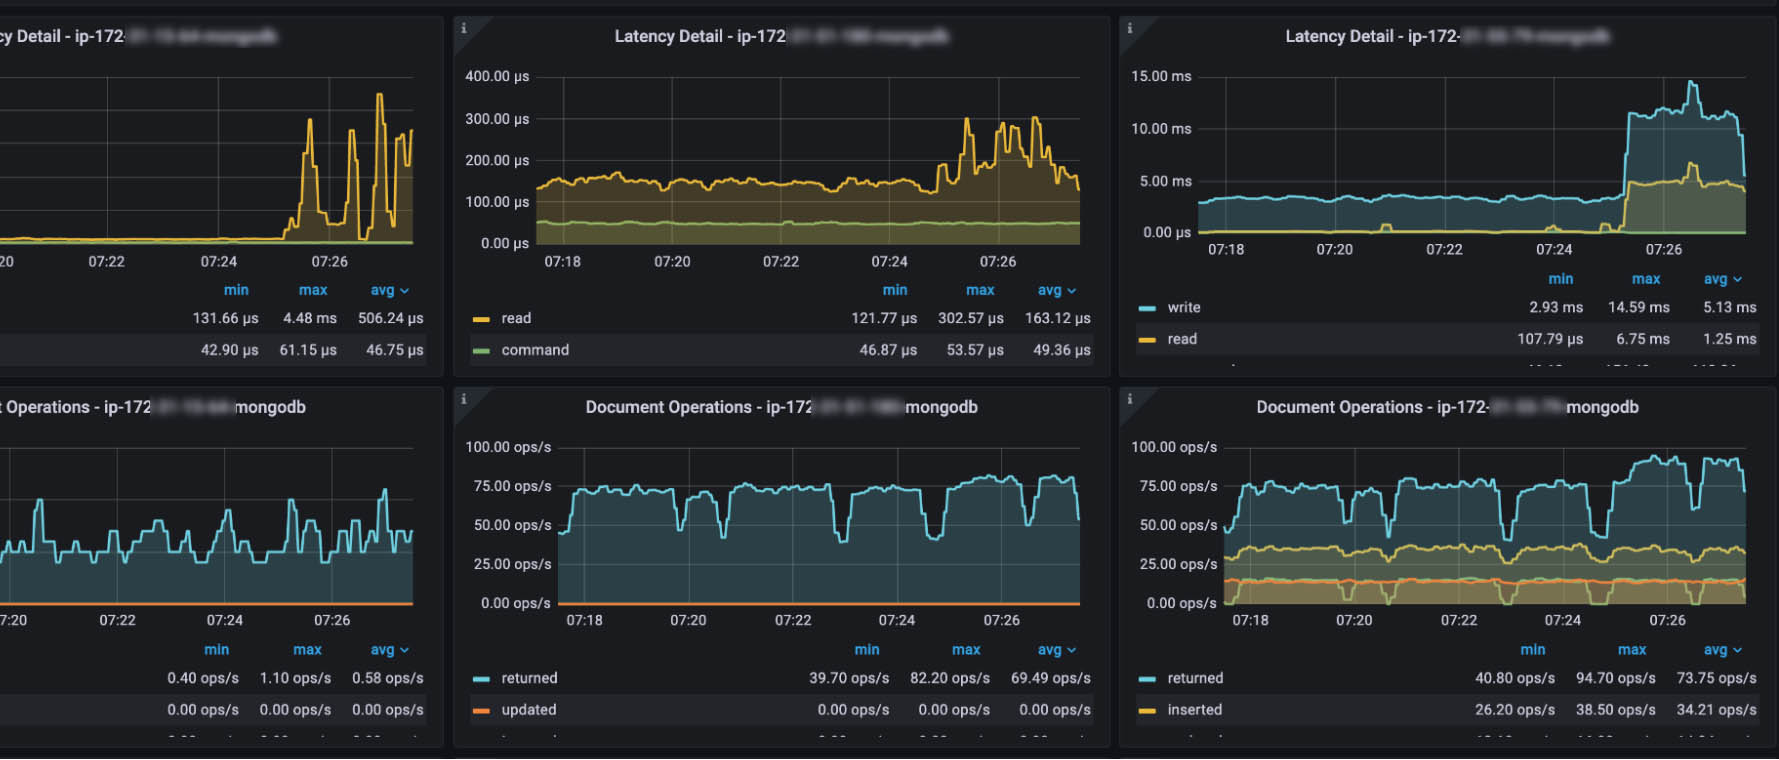
I have made a test run on the application side and checked the profiler there, too. The app worked poorly, and queries were slow.
Finding the cause of the problem
I knew the reason was the new feature and immediately rolled back the last changes.
I had a rough idea of where the problem might be, made a few changes, and started again.
I did it several times, but the result was the same (the CPU was loaded at 100%).
I selected a period with a load and used the Query Analytics function built into the monitoring. Query Analytics shows a list of queries sorted by load or execution speed. Some of the queries to the Pages collection gave 90% load, and the Query Time was more than 3 minutes.
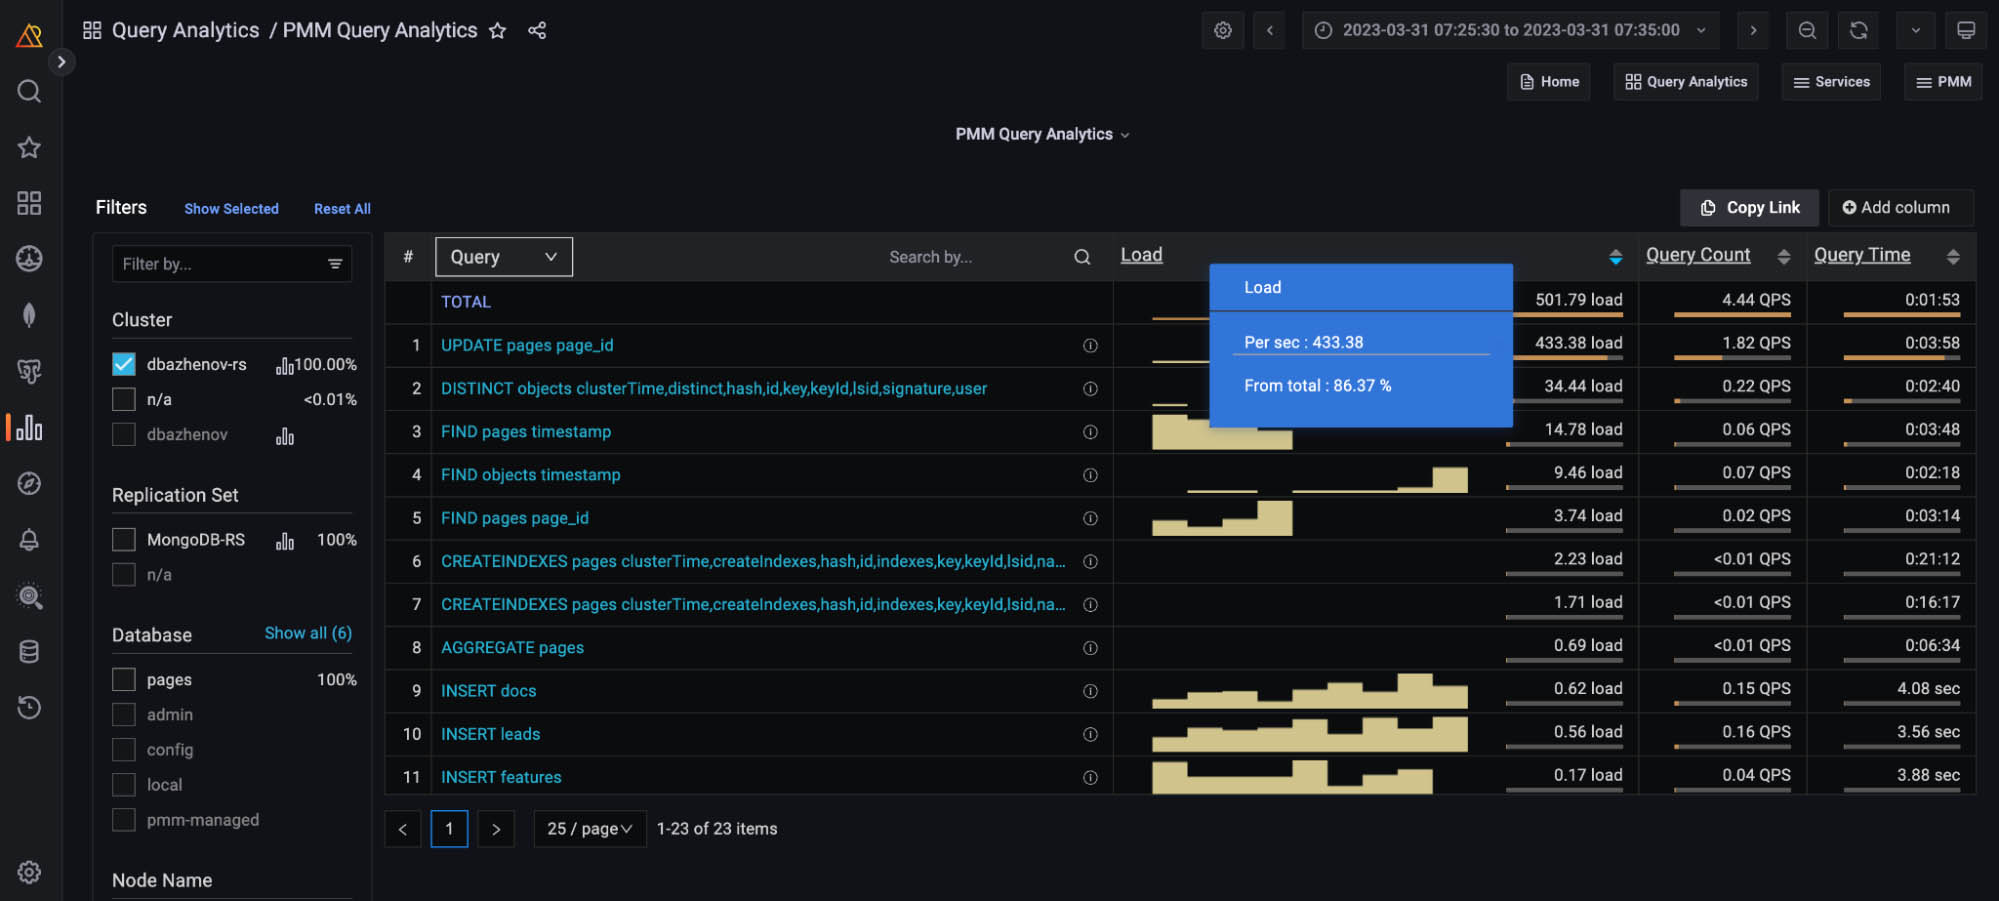
In Query Analytics, you can find slow queries, see their details, and then debug them in the application.
Fixing the problem
I made a few changes that fixed the problem.
The first problem was the indexes. I create indexes from within the application using the command.
$app['db']->CollectionName->createIndex(['index_key' => 1]);
Since the application uses many different collections and queries with conditions on various fields and with or without sorting, I have a lot of indexes.
I made a typo in this case, and the index was not created correctly.
After the indexes were created correctly, I needed quick runs to debug the number of queries to adjust the CPU load to around 50%.
You can see the final chart after debugging and fixing the problem.
Conclusion
Don’t forget to add indexes and make sure they work.
I am a simple developer who can make mistakes and do different experiments. Installing the monitoring was one of the experiments, and previously I just focused on the speed of the PHP script. From time to time, I have looked at the monitoring dashboard in the AWS control panel, but it gives less information, only about the instance itself, without being able to investigate in detail.
So, PMM have a great tools for debugging and searching “bottlenecks” in the databases. And I recommend installing and trying database monitoring with PMM if your application uses MySQL, PostgreSQL, or MongoDB. ∎


Discussion
We invite you to our forum for discussion. You are welcome to use the widget below.