Let’s say you have a fresh MySQL installation. Are there any possible steps to improve performance right away? Yes, there are!
Recently, Marcos Albe (Principal Support Engineer, Percona) did an online tuning on the MySQL Meetup hosted by Matt Yonkovit (Head of Open Source Strategy, Percona). Here are some steps you can consider to make your fresh MySQL installation to run better right from the start.
So, we have a very basic default MySQL installation with some workload. It is connected to PMM, the slow query log is turned on. But it is largely unconfigured. Here is what actions Marcos considered to take to set up a new system to make sure that it’s actually set up from the beginning to reasonable defaults. Do some reactive configuration - go through the workload, observe bottlenecks and then configure to avoid bottlenecks
Step 1. Rate Limit for Slow Queries
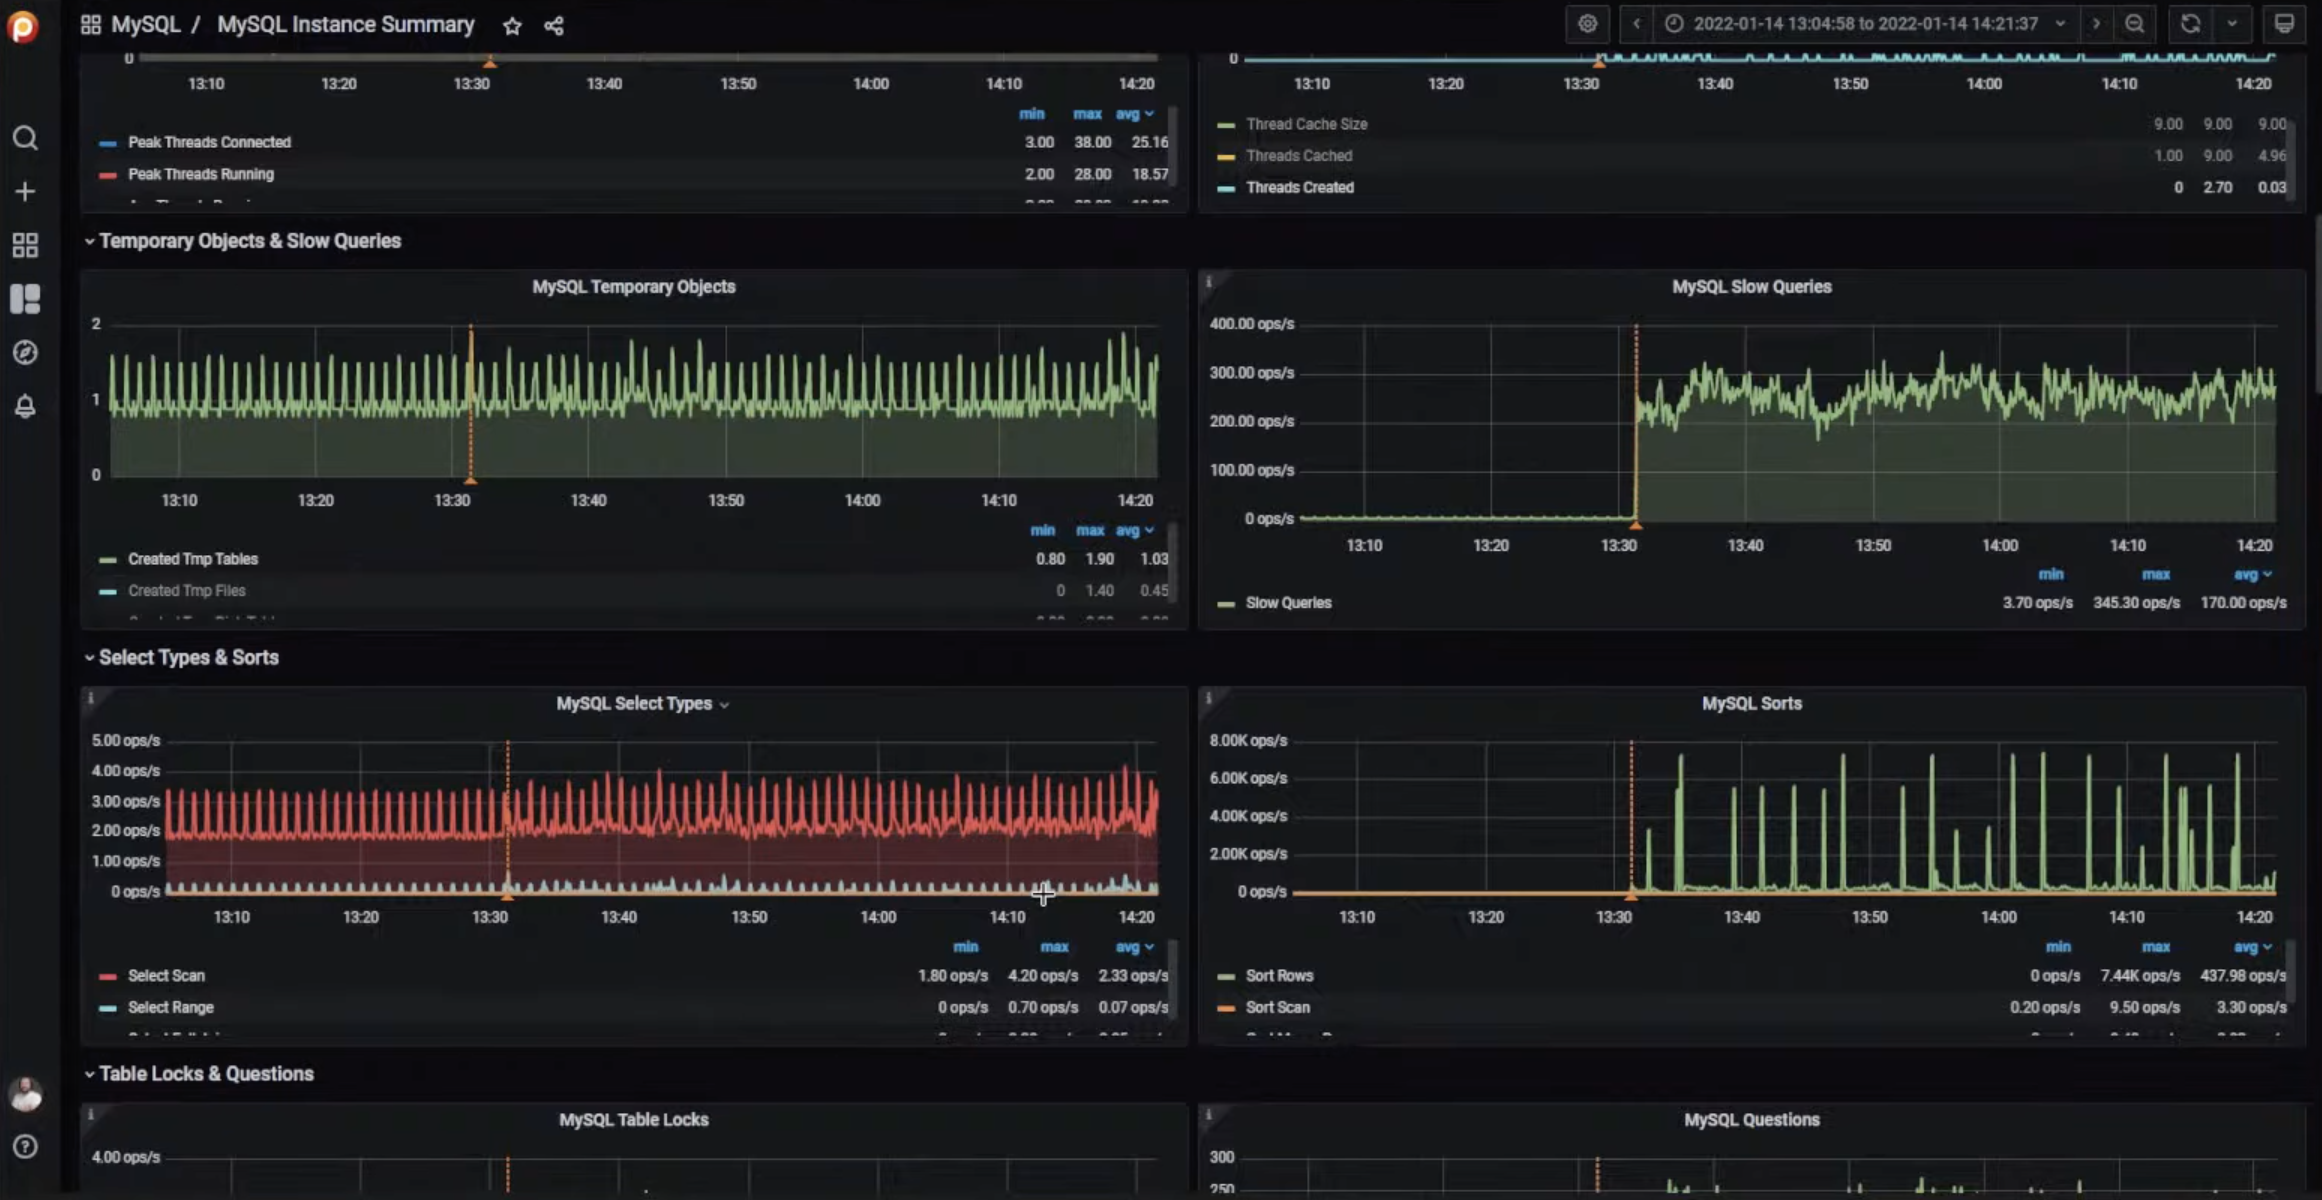
Go to MySQL Summary Dashboard In PMM, find your instance and set a rate limit instead of setting low query time to zero. Once we get to the 3000-4000 queries per second, these might start impacting performance in a way that is going to show in the latency papers. The thing is that while it is important to collect as many query details as possible, you don’t want to collect too many because it can impact performance and have the opposite effect of what you’re trying to do.
Step 2. Spikes
Go down and turn the metrics off and on from data series from each of the graphs to be able to see the spikes on each magnitude. It allows you to find bad query patterns, under-dimensional or over-dimensional things.
Think of it as workload being the light, MySQL being the prism and the metrics being the reflection of the light.
Doing this, you can suggest different changes, like trying a slightly larger buffer size or increasing the thread cache. And as you go through the metrics, look at the values in the configuration, at the workload, and the actual work to find out if your hypotheses is correct.

Step 3. Buffer Pool Size
Increase the buffer pool size. It is probably the most used and most recommended setting.
Step 4. Redo Log Size
Increase the redo log size and restart the instance. Make the redo log file as large as reasonably possible. What is reasonable? Reasonable is an amount of time that will allow you to write at that rate for the duration of your big workload. The purpose is to allow more pages during the heavy write periods. The only thing you could fear here is the recovery time. You should do some testing to see if the recovery times are acceptable, just like you do for backups. And then if the time of recovery is unacceptable, you should consider having a HA setup, semi-synchronous or virtually synchronous setup, where you can failover to the next instance when this one crashes. Also, you could get faster drives, or you could try to convince your developers to write less
Step 5. InnoDB IO Capacity
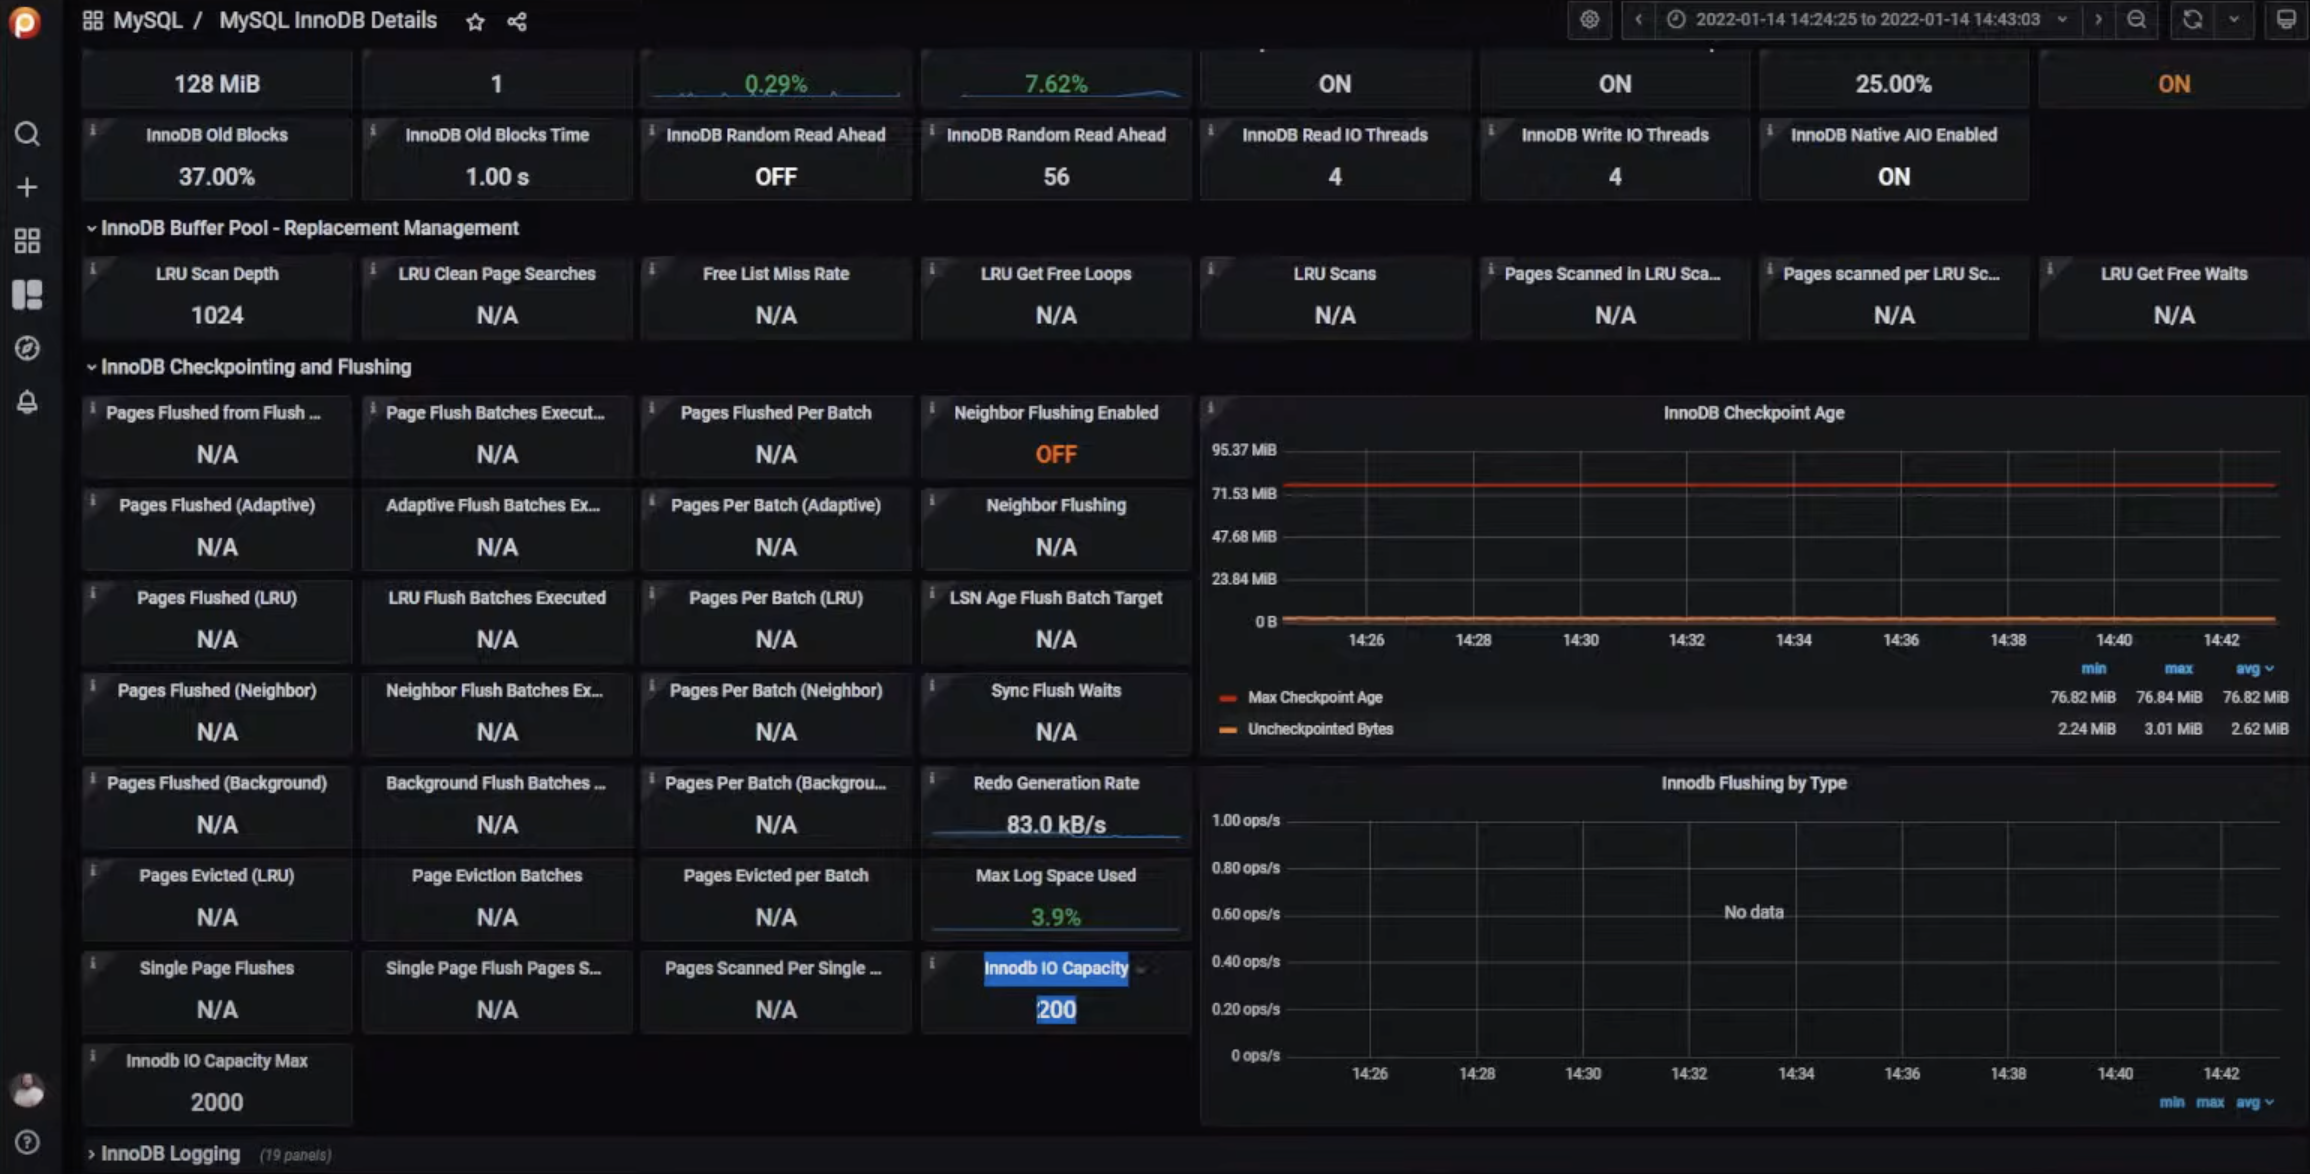
Set InnoDB IO capacity to 200 unless you have proof you need more. Otherwise, you’re just forcing the flushing to happen too early. The thing is that you want to keep dirty pages. Dirty pages are the performance optimization. Imagine that you update the views counter for a popular video 100 times per second. If you have a very high capacity, you will probably write that road 50 times per second to disk. If you have a smaller capacity, you will probably write it once every few seconds. And then you’re actually only doing one write for hundreds of updates because all the rest were in memory and on the redo log.

Conclusion
If you want to watch the video of the meetup and see how Marcos tuned the installation, it is always available on the Community Website. The meetups for MySQL, PostgreSQL, PMM, and MongoDB are regularly live-streamed. Stay tuned to announcements and feel free to join! ∎
Discussion
We invite you to our forum for discussion. You are welcome to use the widget below.