
Create your own Exporter in Go!
Overview
Hi, it’s too hot summer in Korea. Today I want to talk about an interesting and exciting topic. Try to making your own exporter in Go language.
If you register a specific query, it is a simple program that shows the result of this query as an exporter result metrics. Some of you may still be unfamiliar with what Expoter is.
I will explain about Exporter step by step in today’s post.
Exporter?
You can think of an Exporter as an HTTP server for pulling data from a time series database like Prometheus. Prometheus periodically calls the specific URL of the exporter and saves the result of metrics as a time series.
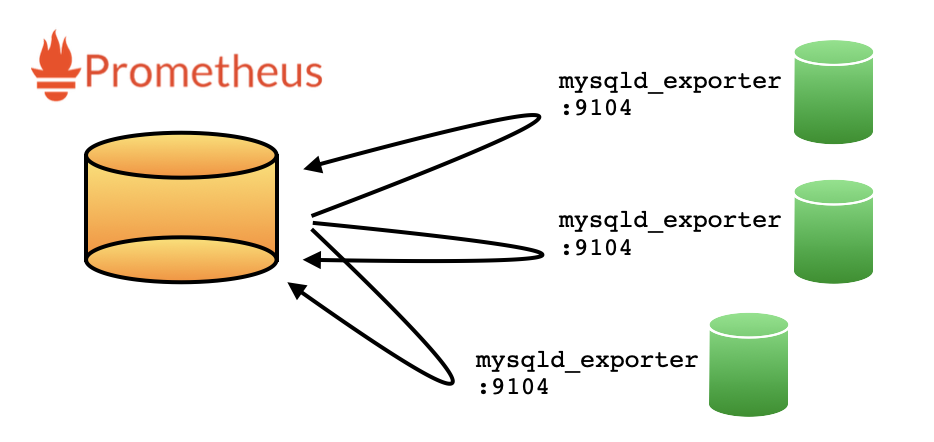
There are many exporters exist in the everywhere.
Typically, there is mysqld_expoter, which is Prometheus’s Offcial projects, and mysqld_expoter, which they fork and distribute additionally in Percona. Besides these, not only node_expoter for monitoring Linux nodes, but also memcached_expoter etc..
For reference, you can see various exporters from exporterhub.
What I am going to present my Blog that is the process of adding my own new exporter among these various exporters. Let’s go!
Creating a Go project
Exporter can be implemented in various languages, but today I will implement it with Go.
Personally, I think Go is very convenient in terms of distribution and compatibility. I will omit the go installation and environment configuration here.
$ cd ~/go/src

$ mkdir -p query-exporter-simple

$ cd query-exporter-simple

$ go mod init
go: creating new go.mod: module query-exporter-simple

$ ls -al
total 8
drwxr-xr-x   3 chan  staff   96  7 12 13:33 .
drwxr-xr-x  12 chan  staff  384  7 12 13:33 ..
-rw-r--r--   1 chan  staff   38  7 12 13:33 go.mod

$ cat go.mod
module query-exporter-simple

go 1.16
Although it is an fundamental project, now everything is ready to make your own exporter. From now on, package management is managed with go mod.
Try Empty Exporter
Now, let’s start making the Exporter in earnest.
First, as a taster, let’s try to make an empty Exporter that has no function.. it simply outputs the exporter version only.
This is to read OS parameters using flags. The “bind” is server HTTP binding information when Exporter is started.
package main

import (
    "flag"
)

func main() {
    // =====================
    // Get OS parameter
    // =====================
    var bind string
    flag.StringVar(&bind, "bind", "0.0.0.0:9104", "bind")
    flag.Parse()
}
Register Collector to collect and run Exporter with HTTP server. Collector is the concept of a thread that collects information, and it implements the Collector interface of Prometheus.
package main

import (
    "flag"
    "net/http"

    "github.com/prometheus/client_golang/prometheus"
    "github.com/prometheus/client_golang/prometheus/promhttp"
    "github.com/prometheus/common/version"
    log "github.com/sirupsen/logrus"
)

func main() {
    // =====================
    // Get OS parameter
    // =====================
    var bind string
    flag.StringVar(&bind, "bind", "0.0.0.0:9104", "bind")
    flag.Parse()

    // ========================
    // Regist handler
    // ========================
    prometheus.Register(version.NewCollector("query_exporter"))

    // Regist http handler
    http.HandleFunc("/metrics", func(w http.ResponseWriter, r *http.Request) {
        h := promhttp.HandlerFor(prometheus.Gatherers{
            prometheus.DefaultGatherer,
        }, promhttp.HandlerOpts{})
        h.ServeHTTP(w, r)
    })

    // start server
    log.Infof("Starting http server - %s", bind)
    if err := http.ListenAndServe(bind, nil); err != nil {
        log.Errorf("Failed to start http server: %s", err)
    }
}
Since the packages used by source code do not exist in the project yet, numerous errors will be occurred.
So, as below, get related packages through go mod vendor. Related packages are placed under the vendor directory.
$ go mod vendor
go: finding module for package github.com/prometheus/common/version
go: finding module for package github.com/prometheus/client_golang/prometheus
go: finding module for package github.com/sirupsen/logrus
go: finding module for package github.com/prometheus/client_golang/prometheus/promhttp
go: found github.com/prometheus/client_golang/prometheus in github.com/prometheus/client_golang v1.11.0
go: found github.com/prometheus/client_golang/prometheus/promhttp in github.com/prometheus/client_golang v1.11.0
go: found github.com/prometheus/common/version in github.com/prometheus/common v0.29.0
go: found github.com/sirupsen/logrus in github.com/sirupsen/logrus v1.8.1

$ ls -al
total 112
drwxr-xr-x   6 chan  staff    192  7 13 10:26 .
drwxr-xr-x  12 chan  staff    384  7 12 13:33 ..
-rw-r--r--   1 chan  staff    169  7 13 10:26 go.mod
-rw-r--r--   1 chan  staff  45722  7 13 10:26 go.sum
-rw-r--r--   1 chan  staff   1163  7 13 10:34 main.go
drwxr-xr-x   6 chan  staff    192  7 13 10:26 vendor
If you start the Exporter server, the server will be run on port 9104 (the port specified by default in flag).
$ go run .
INFO[0000] Regist version collector - query_exporter
INFO[0000] HTTP handler path - /metrics
INFO[0000] Starting http server - 0.0.0.0:9104
If you want to change the port, give the bind OS parameter as below, then, the server will run with that port.
$ go run . --bind=0.0.0.0:9105
INFO[0000] Regist version collector - query_exporter
INFO[0000] HTTP handler path - /metrics
INFO[0000] Starting http server - 0.0.0.0:9105
Even though it is an empty Exporter.. You can see that a lot of information is extracted through the Exporter. (Most of the information is about go itself..)
$ curl 127.0.0.1:9104/metrics
# HELP go_gc_duration_seconds A summary of the pause duration of garbage collection cycles.
# TYPE go_gc_duration_seconds summary
go_gc_duration_seconds{quantile="0"} 0
go_gc_duration_seconds{quantile="0.25"} 0

.. skip ..

# HELP go_threads Number of OS threads created.
# TYPE go_threads gauge
go_threads 7
# HELP query_exporter_build_info A metric with a constant '1' value labeled by version, revision, branch, and goversion from which query_exporter was built.
# TYPE query_exporter_build_info gauge
query_exporter_build_info{branch="",goversion="go1.16.5",revision="",version=""} 1
At the very bottom, there is the query_exporter_build_info metric, which is the information collected by the Collector that we added in the previous section. This is the moment we created the new Exporter collecting version information!
Creating an Exporter in earnest
I made an empty Exporter that specifies only the exporter version. Is that easy, right? 🙂
From now on, I’m going to implement a Collector that collects the information we really need from database and sends the result to the HTTP GET method.
1. Configuration format (YAML)
As I said before, I want to make something that passes the result of the registered query to the Exporter result metric. To do this, you need to know information about the target instance as well as the query to be executed.
Let’s set it up in the below format. MySQL connection information and the query to be executed. It will show two pieces of information as a result: “Connections per host” and “Connections per user”.
dsn: test:test123@tcp(127.0.0.1:3306)/information_schema
metrics:
  process_count_by_host:
    query: "select user,
                  substring_index(host, ':', 1) host,
                  count(*) sessions
            from information_schema.processlist
            group by 1,2 "
    type: gauge
    description: "process count by host"
    labels: ["user","host"]
    value: sessions
  process_count_by_user:
    query: "select user, count(*) sessions
            from information_schema.processlist
            group by 1 "
    type: gauge
    description: "process count by user"
    labels: ["user"]
    value: sessions
I tried defining the above yaml as Go structure.
type Config struct {
    DSN     string
    Metrics map[string]struct {
        Query       string
        Type        string
        Description string
        Labels      []string
        Value       string
        metricDesc  *prometheus.Desc
    }
}
Here, metricDesc *prometheus.Desc can be understood as a specification used in Prometheus metrics. It also specifies any label and metric types such as Counter/Gauge.
Read the YAML file as below, and finally load the setting information into the structure defined below.
var b []byte
var config Config
if b, err = ioutil.ReadFile("config.yml"); err != nil {
    log.Errorf("Failed to read config file: %s", err)
    os.Exit(1)
}

// Load yaml
if err := yaml.Unmarshal(b, &config); err != nil {
    log.Errorf("Failed to load config: %s", err)
    os.Exit(1)
}
In this way, we can now put the necessary information in the Config structure and use it to implement the desired implementation.
package main

import (
    "flag"
    "io/ioutil"
    "net/http"
    "os"

    "github.com/ghodss/yaml"
    "github.com/prometheus/client_golang/prometheus"
    "github.com/prometheus/client_golang/prometheus/promhttp"
    "github.com/prometheus/common/version"
    log "github.com/sirupsen/logrus"
)

var config Config

func main() {
    var err error
    var configFile, bind string
    // =====================
    // Get OS parameter
    // =====================
    flag.StringVar(&configFile, "config", "config.yml", "configuration file")
    flag.StringVar(&bind, "bind", "0.0.0.0:9104", "bind")
    flag.Parse()

    // =====================
    // Load config & yaml
    // =====================
    var b []byte
    if b, err = ioutil.ReadFile(configFile); err != nil {
        log.Errorf("Failed to read config file: %s", err)
        os.Exit(1)
    }

    // Load yaml
    if err := yaml.Unmarshal(b, &config); err != nil {
        log.Errorf("Failed to load config: %s", err)
        os.Exit(1)
    }

    // ========================
    // Regist handler
    // ========================
    log.Infof("Regist version collector - %s", "query_exporter")
    prometheus.Register(version.NewCollector("query_exporter"))

    // Regist http handler
    log.Infof("HTTP handler path - %s", "/metrics")
    http.HandleFunc("/metrics", func(w http.ResponseWriter, r *http.Request) {
        h := promhttp.HandlerFor(prometheus.Gatherers{
            prometheus.DefaultGatherer,
        }, promhttp.HandlerOpts{})
        h.ServeHTTP(w, r)
    })

    // start server
    log.Infof("Starting http server - %s", bind)
    if err := http.ListenAndServe(bind, nil); err != nil {
        log.Errorf("Failed to start http server: %s", err)
    }
}

// =============================
// Config config structure
// =============================
type Config struct {
    DSN     string
    Metrics map[string]struct {
        Query       string
        Type        string
        Description string
        Labels      []string
        Value       string
        metricDesc  *prometheus.Desc
    }
}
2. Implement Collector
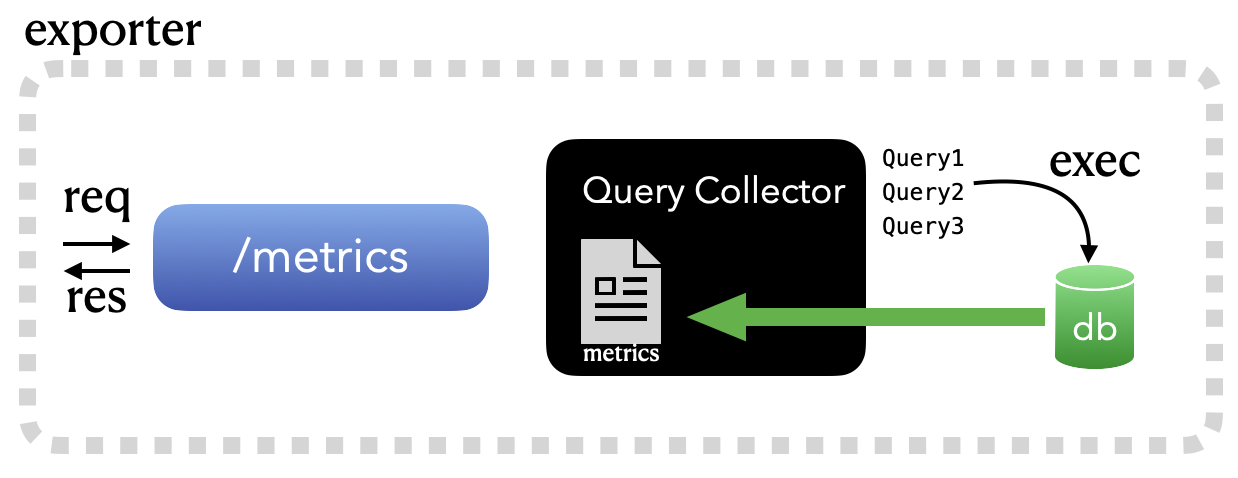
The highlight of today’s post is the implementing a Collector to collect the desired information from database.
All the processes I implemented so far is to get the results as an HTTP result. Collector actually connect to the database and delivering the specified metric result based on the result of executing the specified query.
type QueryCollector struct{}

// Describe prometheus describe
func (e *QueryCollector) Describe(ch chan<- *prometheus.Desc) {
}

// Collect prometheus collect
func (e *QueryCollector) Collect(ch chan<- prometheus.Metric) {
}
As I have mentioned earlier, Collector is kind of a thread concept that collects information, and is a structure that implements the Collector interface of Prometheus. In other words, this story means that if you want to create another Collector of your own, you must implement two of the Describe and Collect defined by the prometheus.Collector interface.
Register the Collector defined as below.
func main(){
    .. skip ..
    // ========================
    // Regist handler
    // ========================
    log.Infof("Regist version collector - %s", "query_exporter")
    prometheus.Register(version.NewCollector("query_exporter"))
    prometheus.Register(&QueryCollector{})
    .. skip ..
}
The Version Collector added to the can exporter created earlier and the QueryCollector newly added this time are registered. When an http request comes in to “/metric”, the above two Collectors are finally executed by each thread.
2-1. Create the Describe function
This is the part that defines the specifications of each metric. Actually, it is not necessary to define the specification of the metric here, but it is useful if you consider the case of creating and operating multiple Collectors. This method is executed only once when a Collector is registered with prometheus.Register.
func (e *QueryCollector) Describe(ch chan<- *prometheus.Desc) {
    for metricName, metric := range config.Metrics {
        metric.metricDesc = prometheus.NewDesc(
            prometheus.BuildFQName("query_exporter", "", metricName),
            metric.Description,
            metric.Labels, nil,
        )
        config.Metrics[metricName] = metric
        log.Infof("metric description for \"%s\" registerd", metricName)
    }
}
Here, I have defined the specification of the metric with the information related to Query in the setting information read earlier.
- prometheus.BuildFQName: name of metric
- metric.Description: Description
- metric.Labels: Array of label names, label values should be mapped later in this order
If you look at the config.yml, each mapping will be as follows.
metrics:
  # metricName
  process_count_by_user:
    ## metric.Description
    description: "process count by user"
    ## metric.Labels
    labels: ["user"]
2-2. Create the Collect function
This is the part that connects to the DB, executes the registered SQL, and makes it a metric.
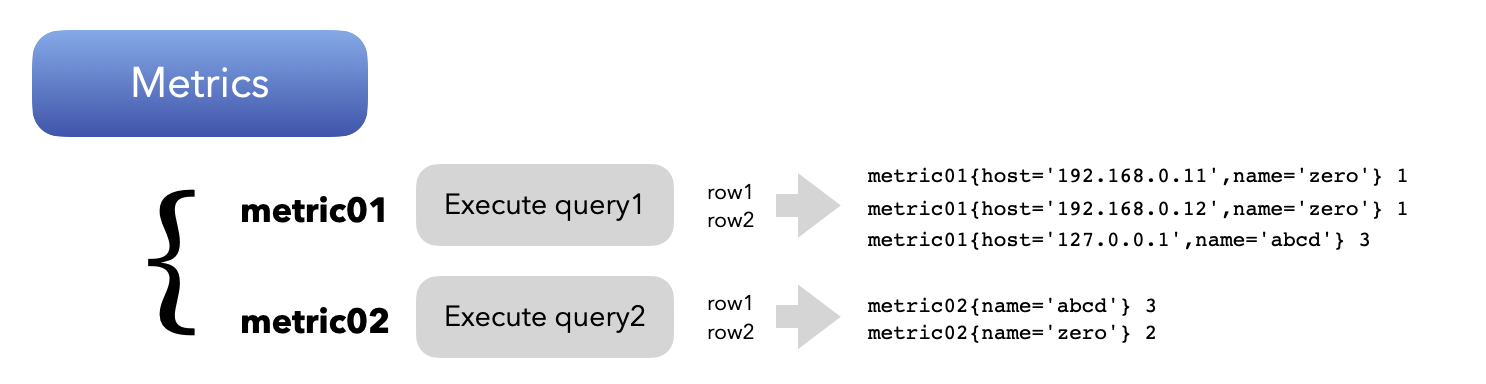
The execution results(rows) of each query are displayed as a metric name and values as shown in the figure above.
func (e *QueryCollector) Collect(ch chan<- prometheus.Metric) {

    // Connect to database
    db, err := sql.Open("mysql", config.DSN)
    if err != nil {
        log.Errorf("Connect to database failed: %s", err)
        return
    }
    defer db.Close()

    // Execute each queries in metrics
    for name, metric := range config.Metrics {

        // Execute query
        rows, err := db.Query(metric.Query)
        if err != nil {
            log.Errorf("Failed to execute query: %s", err)
            continue
        }

        // Get column info
        cols, err := rows.Columns()
        if err != nil {
            log.Errorf("Failed to get column meta: %s", err)
            continue
        }

        des := make([]interface{}, len(cols))
        res := make([][]byte, len(cols))
        for i := range cols {
            des[i] = &res[i]
        }

        // fetch database
        for rows.Next() {
            rows.Scan(des...)
            data := make(map[string]string)
            for i, bytes := range res {
                data[cols[i]] = string(bytes)
            }

            // Metric labels
            labelVals := []string{}
            for _, label := range metric.Labels {
                labelVals = append(labelVals, data[label])
            }

            // Metric value
            val, _ := strconv.ParseFloat(data[metric.Value], 64)

            // Add metric
            switch strings.ToLower(metric.Type) {
            case "counter":
                ch <- prometheus.MustNewConstMetric(metric.metricDesc, prometheus.CounterValue, val, labelVals...)
            case "gauge":
                ch <- prometheus.MustNewConstMetric(metric.metricDesc, prometheus.GaugeValue, val, labelVals...)
            default:
                log.Errorf("Fail to add metric for %s: %s is not valid type", name, metric.Type)
                continue
            }
        }
    }
}
As you can see from the labelVals value, you need to pass the label values in the order of Labels of the specification defined in Describe earlier. There are two metric types here: counter and gauge. Each type has the following meaning.
- COUNTER: A value that only increases. In prometheus, the indicator is displayed as a change calculation function such as rate/irate.
- GAUGE: A type whose value can increase/decrease, such as like car gauge. In general, it is used to save the current metric value as it is, such as process count.
// COUNTER
ch <- prometheus.MustNewConstMetric(metric.metricDesc, prometheus.CounterValue, val, labelVals...)

// GAUGE
ch <- prometheus.MustNewConstMetric(metric.metricDesc, prometheus.GaugeValue, val, labelVals...)
For the value to be displayed as a metric, the value item specified in the setting is retrieved from the query result.
QueryExporter Source
Here’s the everything that I’ve done so far:
package main

import (
    "database/sql"
    "flag"
    "io/ioutil"
    "net/http"
    "os"
    "strconv"
    "strings"

    "github.com/ghodss/yaml"
    _ "github.com/go-sql-driver/mysql"
    "github.com/prometheus/client_golang/prometheus"
    "github.com/prometheus/client_golang/prometheus/promhttp"
    "github.com/prometheus/common/version"
    log "github.com/sirupsen/logrus"
)

var config Config

const (
    collector = "query_exporter"
)

func main() {
    var err error
    var configFile, bind string
    // =====================
    // Get OS parameter
    // =====================
    flag.StringVar(&configFile, "config", "config.yml", "configuration file")
    flag.StringVar(&bind, "bind", "0.0.0.0:9104", "bind")
    flag.Parse()

    // =====================
    // Load config & yaml
    // =====================
    var b []byte
    if b, err = ioutil.ReadFile(configFile); err != nil {
        log.Errorf("Failed to read config file: %s", err)
        os.Exit(1)
    }

    // Load yaml
    if err := yaml.Unmarshal(b, &config); err != nil {
        log.Errorf("Failed to load config: %s", err)
        os.Exit(1)
    }

    // ========================
    // Regist handler
    // ========================
    log.Infof("Regist version collector - %s", collector)
    prometheus.Register(version.NewCollector(collector))
    prometheus.Register(&QueryCollector{})

    // Regist http handler
    log.Infof("HTTP handler path - %s", "/metrics")
    http.HandleFunc("/metrics", func(w http.ResponseWriter, r *http.Request) {
        h := promhttp.HandlerFor(prometheus.Gatherers{
            prometheus.DefaultGatherer,
        }, promhttp.HandlerOpts{})
        h.ServeHTTP(w, r)
    })

    // start server
    log.Infof("Starting http server - %s", bind)
    if err := http.ListenAndServe(bind, nil); err != nil {
        log.Errorf("Failed to start http server: %s", err)
    }
}

// =============================
// Config config structure
// =============================
type Config struct {
    DSN     string
    Metrics map[string]struct {
        Query       string
        Type        string
        Description string
        Labels      []string
        Value       string
        metricDesc  *prometheus.Desc
    }
}

// =============================
// QueryCollector exporter
// =============================
type QueryCollector struct{}

// Describe prometheus describe
func (e *QueryCollector) Describe(ch chan<- *prometheus.Desc) {
    for metricName, metric := range config.Metrics {
        metric.metricDesc = prometheus.NewDesc(
            prometheus.BuildFQName(collector, "", metricName),
            metric.Description,
            metric.Labels, nil,
        )
        config.Metrics[metricName] = metric
        log.Infof("metric description for \"%s\" registerd", metricName)
    }
}

// Collect prometheus collect
func (e *QueryCollector) Collect(ch chan<- prometheus.Metric) {

    // Connect to database
    db, err := sql.Open("mysql", config.DSN)
    if err != nil {
        log.Errorf("Connect to database failed: %s", err)
        return
    }
    defer db.Close()

    // Execute each queries in metrics
    for name, metric := range config.Metrics {

        // Execute query
        rows, err := db.Query(metric.Query)
        if err != nil {
            log.Errorf("Failed to execute query: %s", err)
            continue
        }

        // Get column info
        cols, err := rows.Columns()
        if err != nil {
            log.Errorf("Failed to get column meta: %s", err)
            continue
        }

        des := make([]interface{}, len(cols))
        res := make([][]byte, len(cols))
        for i := range cols {
            des[i] = &res[i]
        }

        // fetch database
        for rows.Next() {
            rows.Scan(des...)
            data := make(map[string]string)
            for i, bytes := range res {
                data[cols[i]] = string(bytes)
            }

            // Metric labels
            labelVals := []string{}
            for _, label := range metric.Labels {
                labelVals = append(labelVals, data[label])
            }

            // Metric value
            val, _ := strconv.ParseFloat(data[metric.Value], 64)

            // Add metric
            switch strings.ToLower(metric.Type) {
            case "counter":
                ch <- prometheus.MustNewConstMetric(metric.metricDesc, prometheus.CounterValue, val, labelVals...)
            case "gauge":
                ch <- prometheus.MustNewConstMetric(metric.metricDesc, prometheus.GaugeValue, val, labelVals...)
            default:
                log.Errorf("Fail to add metric for %s: %s is not valid type", name, metric.Type)
                continue
            }
        }
    }
}
If the package does not exist, run go mod vendor to download the necessary packages.
Start the server and check the information collected by the actual exporter.
$ go run .
INFO[0000] Regist version collector - query_exporter
INFO[0000] metric description for "process_count_by_host" registerd
INFO[0000] metric description for "process_count_by_user" registerd
INFO[0000] HTTP handler path - /metrics
INFO[0000] Starting http server - 0.0.0.0:9104
If you run it with curl, you can see that the session count per user/host defined in the settings is displayed.
$ curl 127.0.0.1:9104/metrics
# HELP go_gc_duration_seconds A summary of the pause duration of garbage collection cycles.
# TYPE go_gc_duration_seconds summary
go_gc_duration_seconds{quantile="0"} 0
go_gc_duration_seconds{quantile="0.25"} 0

.. skip ..

# HELP query_exporter_build_info A metric with a constant '1' value labeled by version, revision, branch, and goversion from which query_exporter was built.
# TYPE query_exporter_build_info gauge
query_exporter_build_info{branch="",goversion="go1.16.5",revision="",version=""} 1
# HELP query_exporter_process_count_by_host process count by host
# TYPE query_exporter_process_count_by_host gauge
query_exporter_process_count_by_host{host="localhost",user="event_scheduler"} 1
query_exporter_process_count_by_host{host="localhost",user="test"} 1
# HELP query_exporter_process_count_by_user process count by user
# TYPE query_exporter_process_count_by_user gauge
query_exporter_process_count_by_user{user="event_scheduler"} 1
query_exporter_process_count_by_user{user="test"} 1
This is the moment when your own Exporter is created at final!. 🙂
Concluding..
The post was very long. I put the source code in the body several times.. I feel like the amount of text is getting longer.
Anyway, I’ve created my own unique Exporter! I implemented a simple function to simply register a query and extract this result as a metric result, but I think you can add more interesting elements according to your own thoughts as needed.
For reference, the source written above is organized in the following Git.
Sometimes, when I need to monitor hundreds and thousands of servers from one monitoring server, it is sometimes useful to manage the collection of metrics. As of yet, only support with MySQL, I personally create another Query Exporter project. I implemented more parallel processing and timeouts in the above project base.
It’s always been like that… If there is nothing, just create and it If there is, use it well!
I hope to all you have a nice summer. ∎

Discussion
We invite you to our forum for discussion. You are welcome to use the widget below.