
How to contribute Dashboards to PMM
Have you already contributed to Percona’s open-source products or perhaps you wanted to try doing so?
I will tell you how to become a contributor to the popular open-source product from Percona in just a few hours. You don’t need any serious developer skills.
We earlier explained how to contribute to PMM documentation in our last post. Now we will contribute to PMM itself, namely to Dashboards. Dashboards are an important part of PMM, they are seen and used by thousands of users, so your contribution may be of benefit to many others.
You can view the latest version of our demo at https://pmmdemo.percona.com/graph/.
The purpose of this latest article is to introduce you to the process of making changes to Dashboards in PMM, such as creating a new dashboard or improving an existing one. If you want to become a contributor, you will need to repeat the steps from my earlier post.
You need to:
- Have PMM installed on your server. PMM is easy to install via Docker.
- Have a GitHub account and install Git on your computer.
What kind of contribution should I make?
Of course, this is the first question to decide. PMM is a great product that many developers are working on. PMM uses JIRA to track development tasks. You can:
- Explore the tasks and choose an interesting one
- Create your own task from scratch
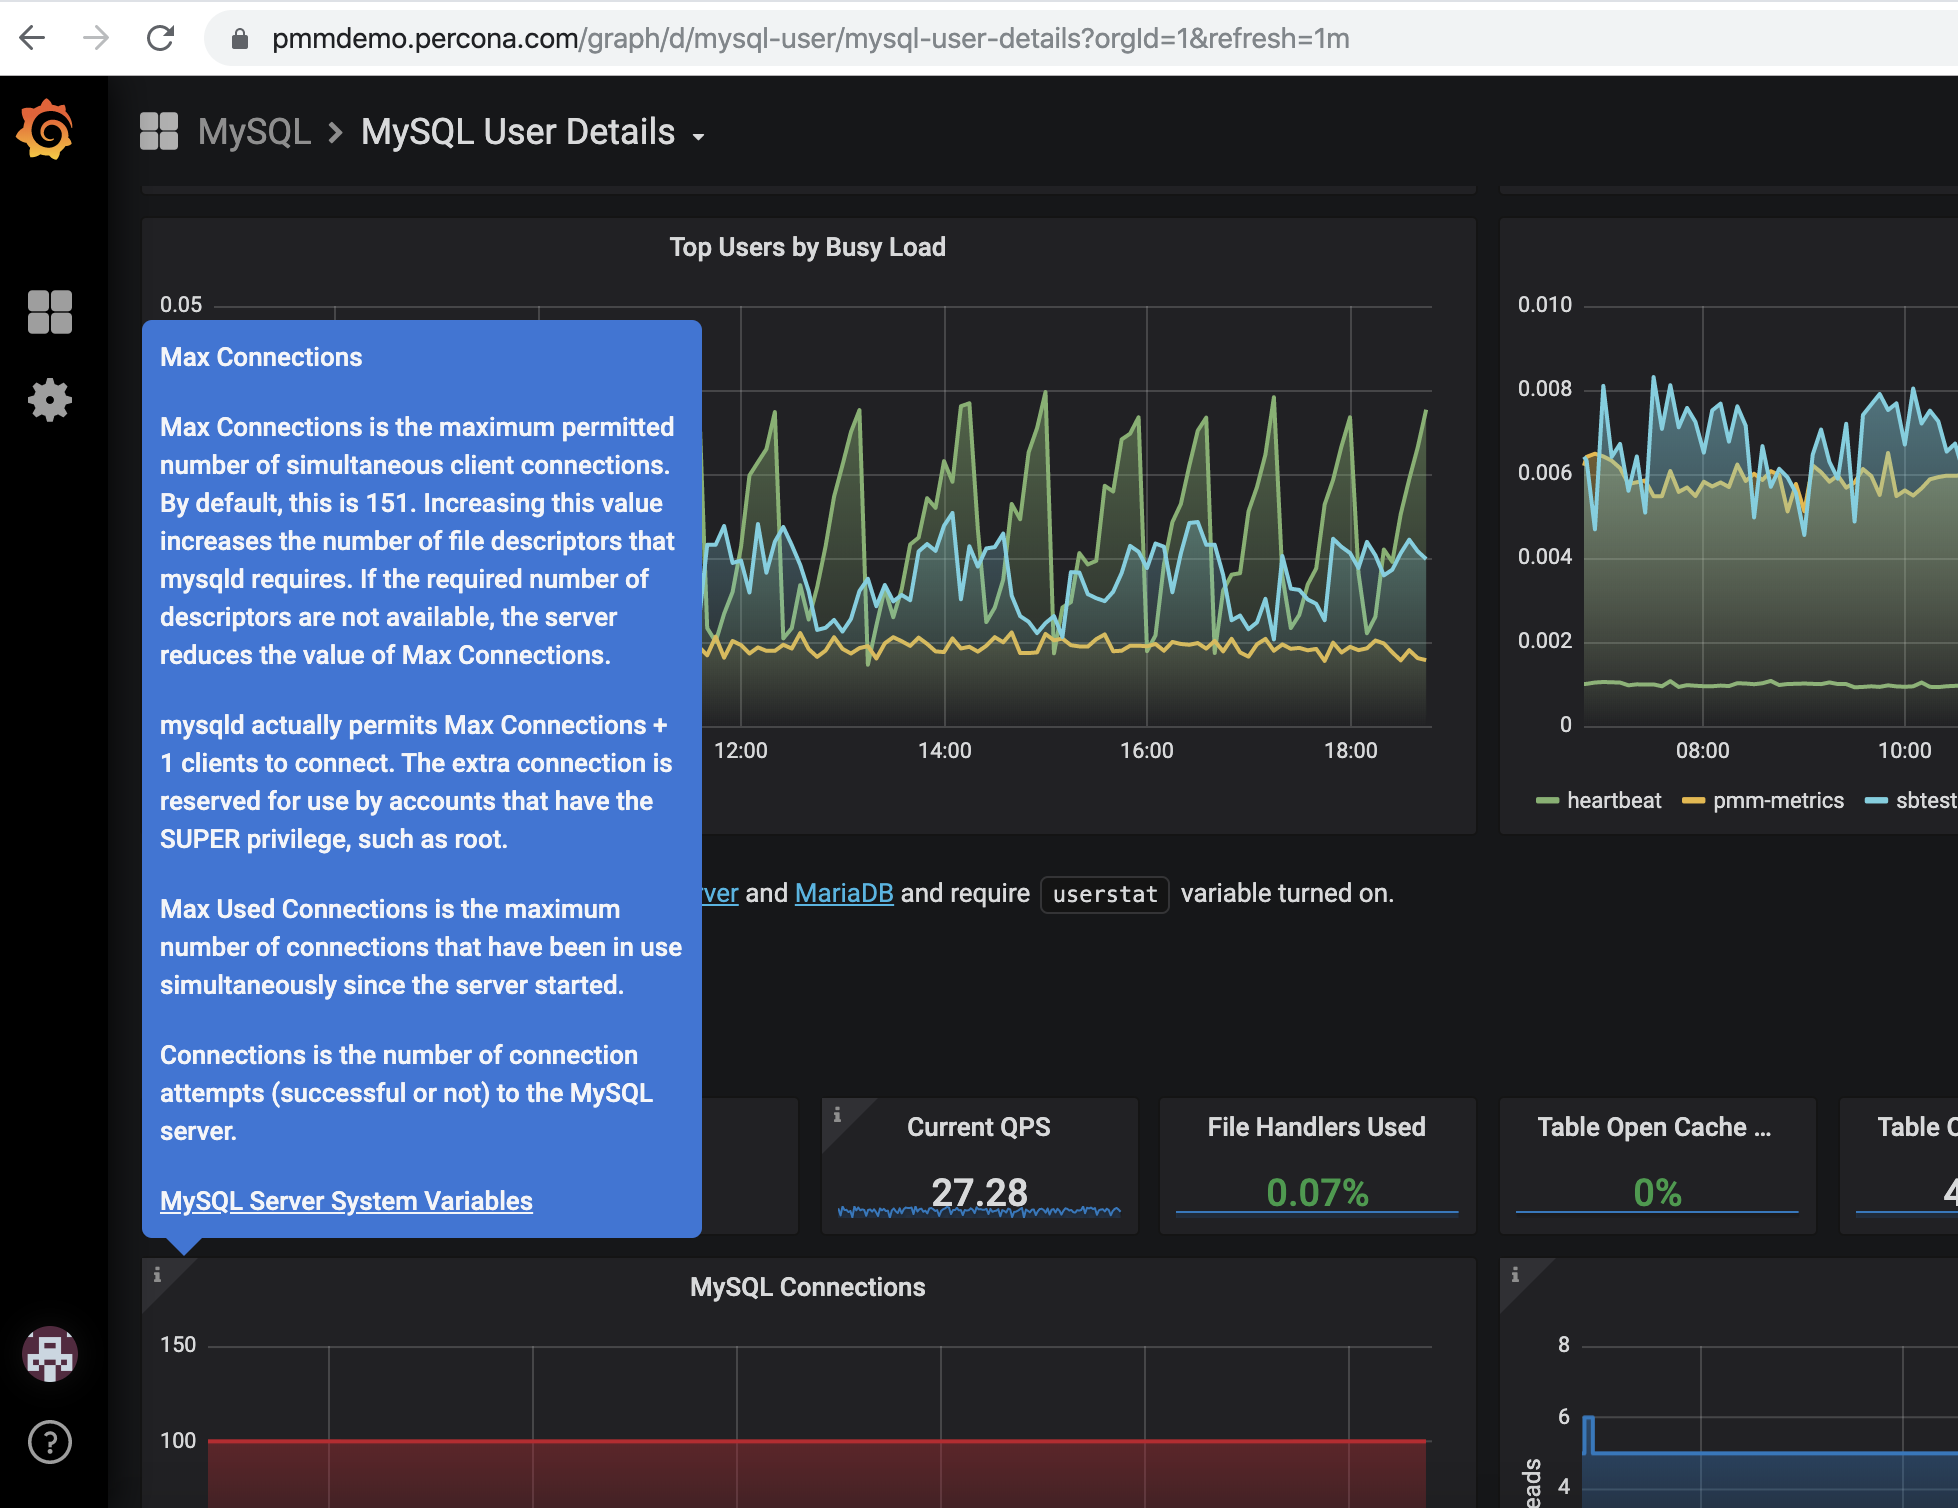
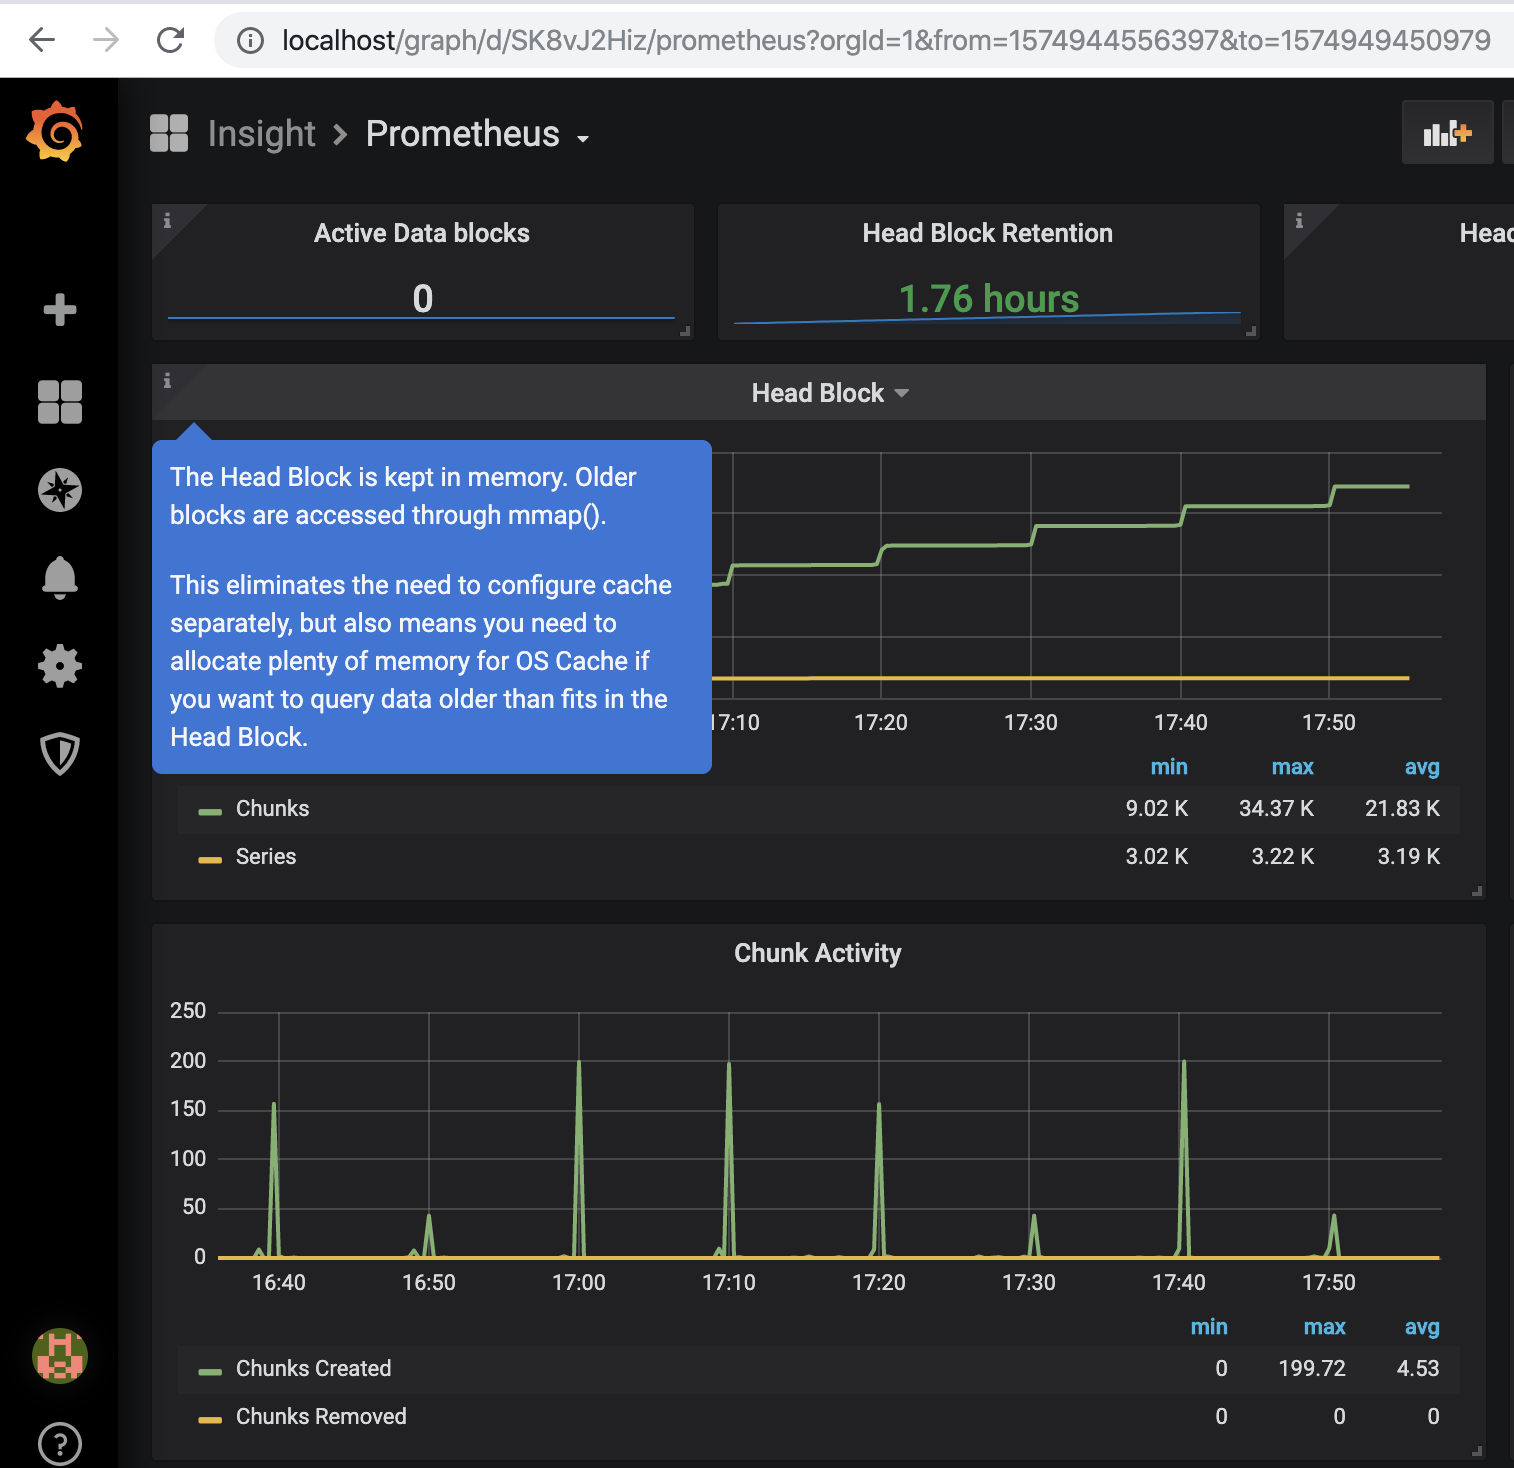
When I used PMM, I noticed that many charts have useful tooltips. Although you can make any sort of contribution, in this article I will use the simplest type of contribution, a tooltip.
Here’s the value of tooltips:
Tooltips - they are written by experts, for consumption by non-experts. One of Percona’s value-add is to write good tooltips that are useful. We (Perconians) know the technologies and we have people who are used to simplifying complex topics.
There are a lot of widgets that haven’t been described yet, so tooltips would hugely increase user experience here. You can open the widget settings and do the following:
- See settings, functions and parameters on which the chart is built.
- Study the documentation for these parameters
- Write a tooltip.
Now that we have defined what we’re about to do, let’s make a tooltip for one of the charts.
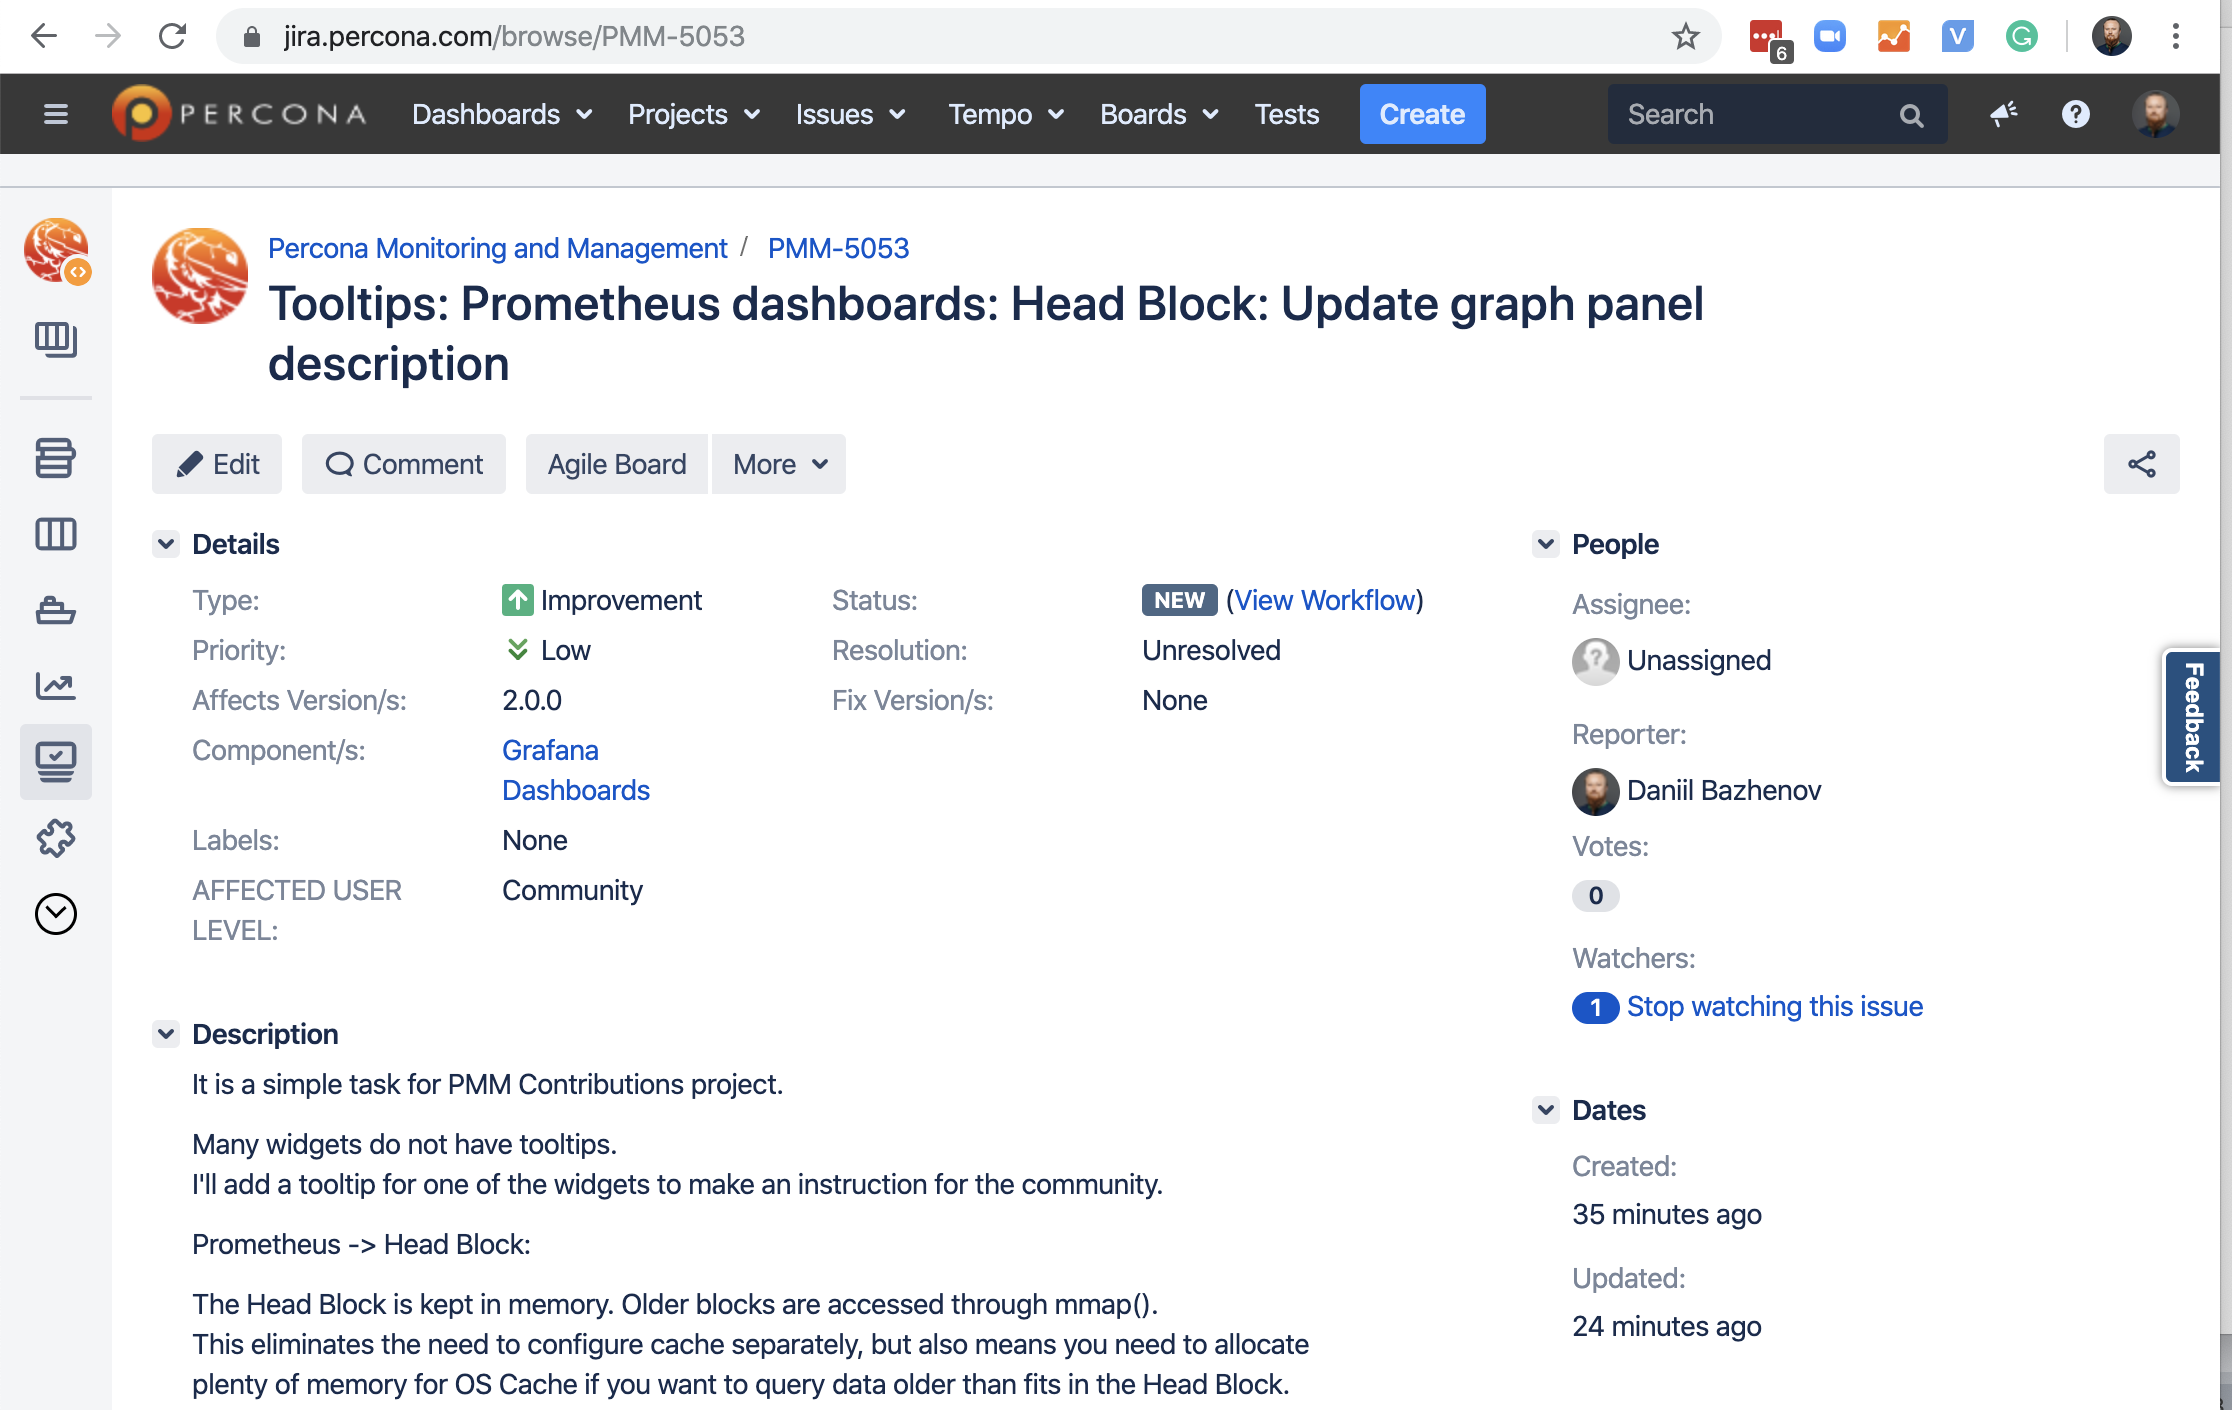
I opened JIRA and created a task where I described what I would do:
Tooltips: Prometheus dashboards: Head Block: Update graph panel description
https://perconadev.atlassian.net/browse/PMM-5053
We’ll find a repository for the Dashboards
We’ll make changes to the code.
PMM is big, for convenience it has a lot of GitHub repositories which can be found in the main repository https://github.com/percona/pmm/tree/PMM-2.0.
Since I will be contributing to Dashboards, I will need a Grafana Dashboard repository: https://github.com/percona/grafana-dashboards
Next I make a fork of this repository in my GitHub account. A fork is needed to check my changes before sending them to the main repository.
By the way, more than 600 people have already done it. You can do it, too! :)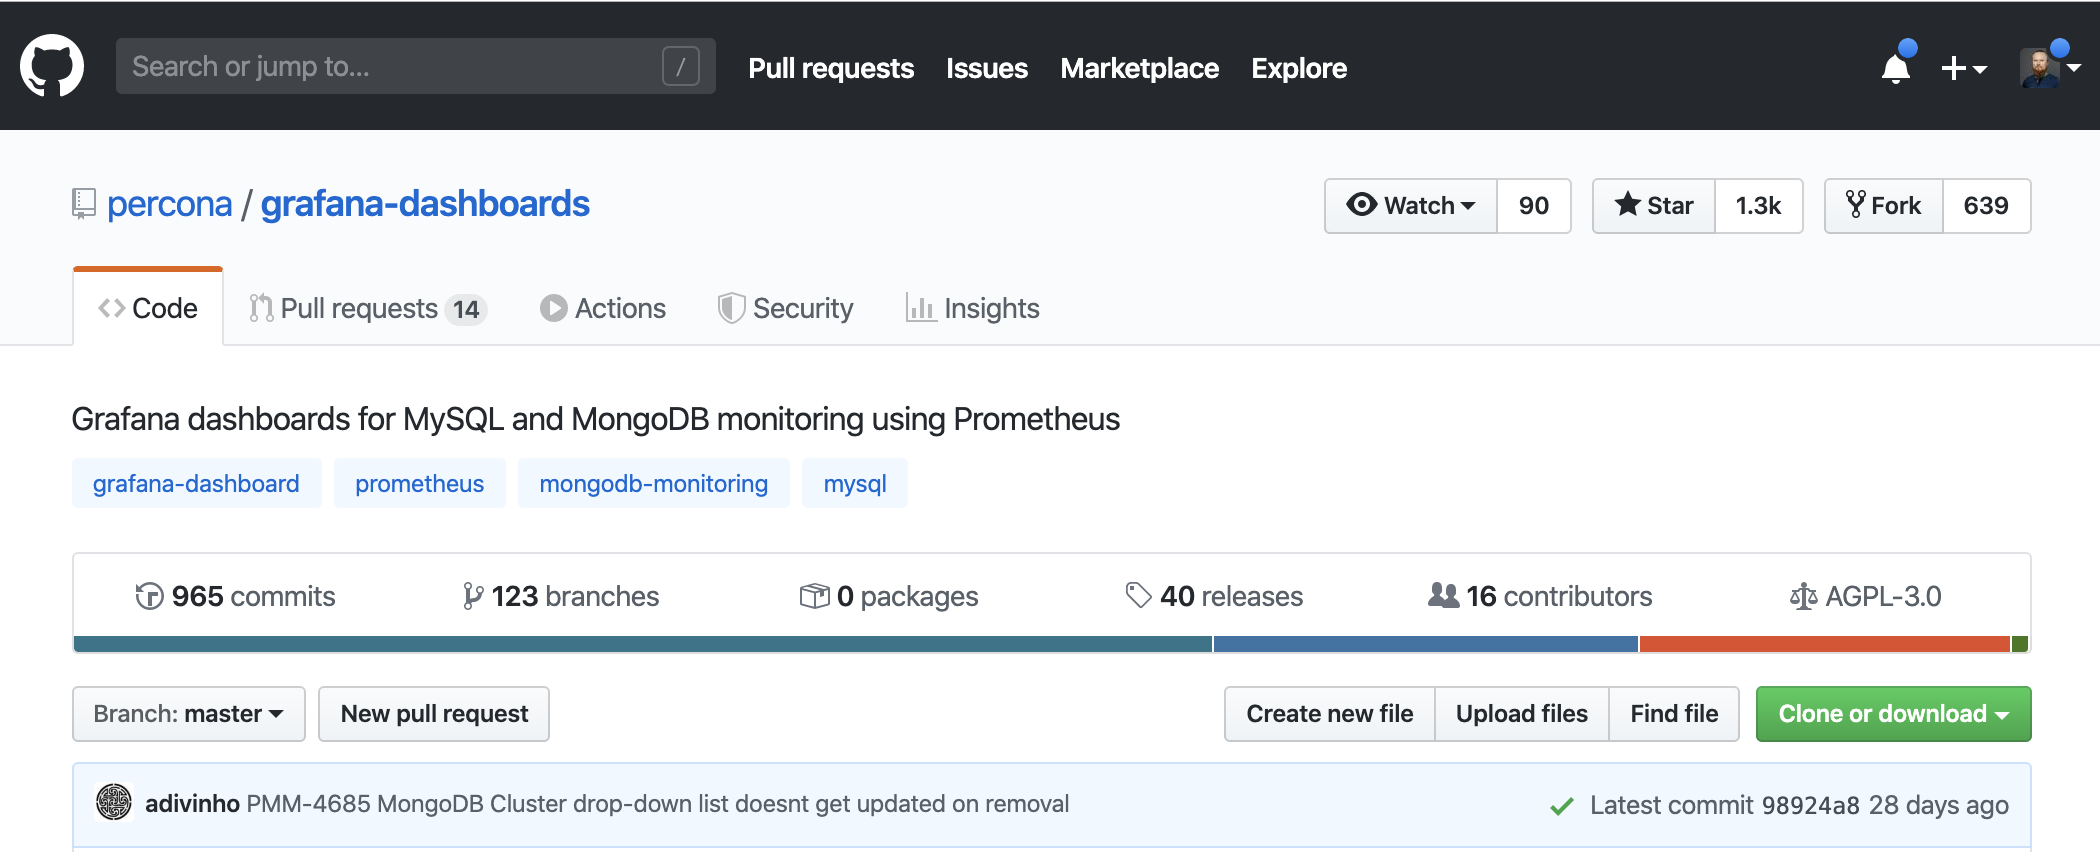
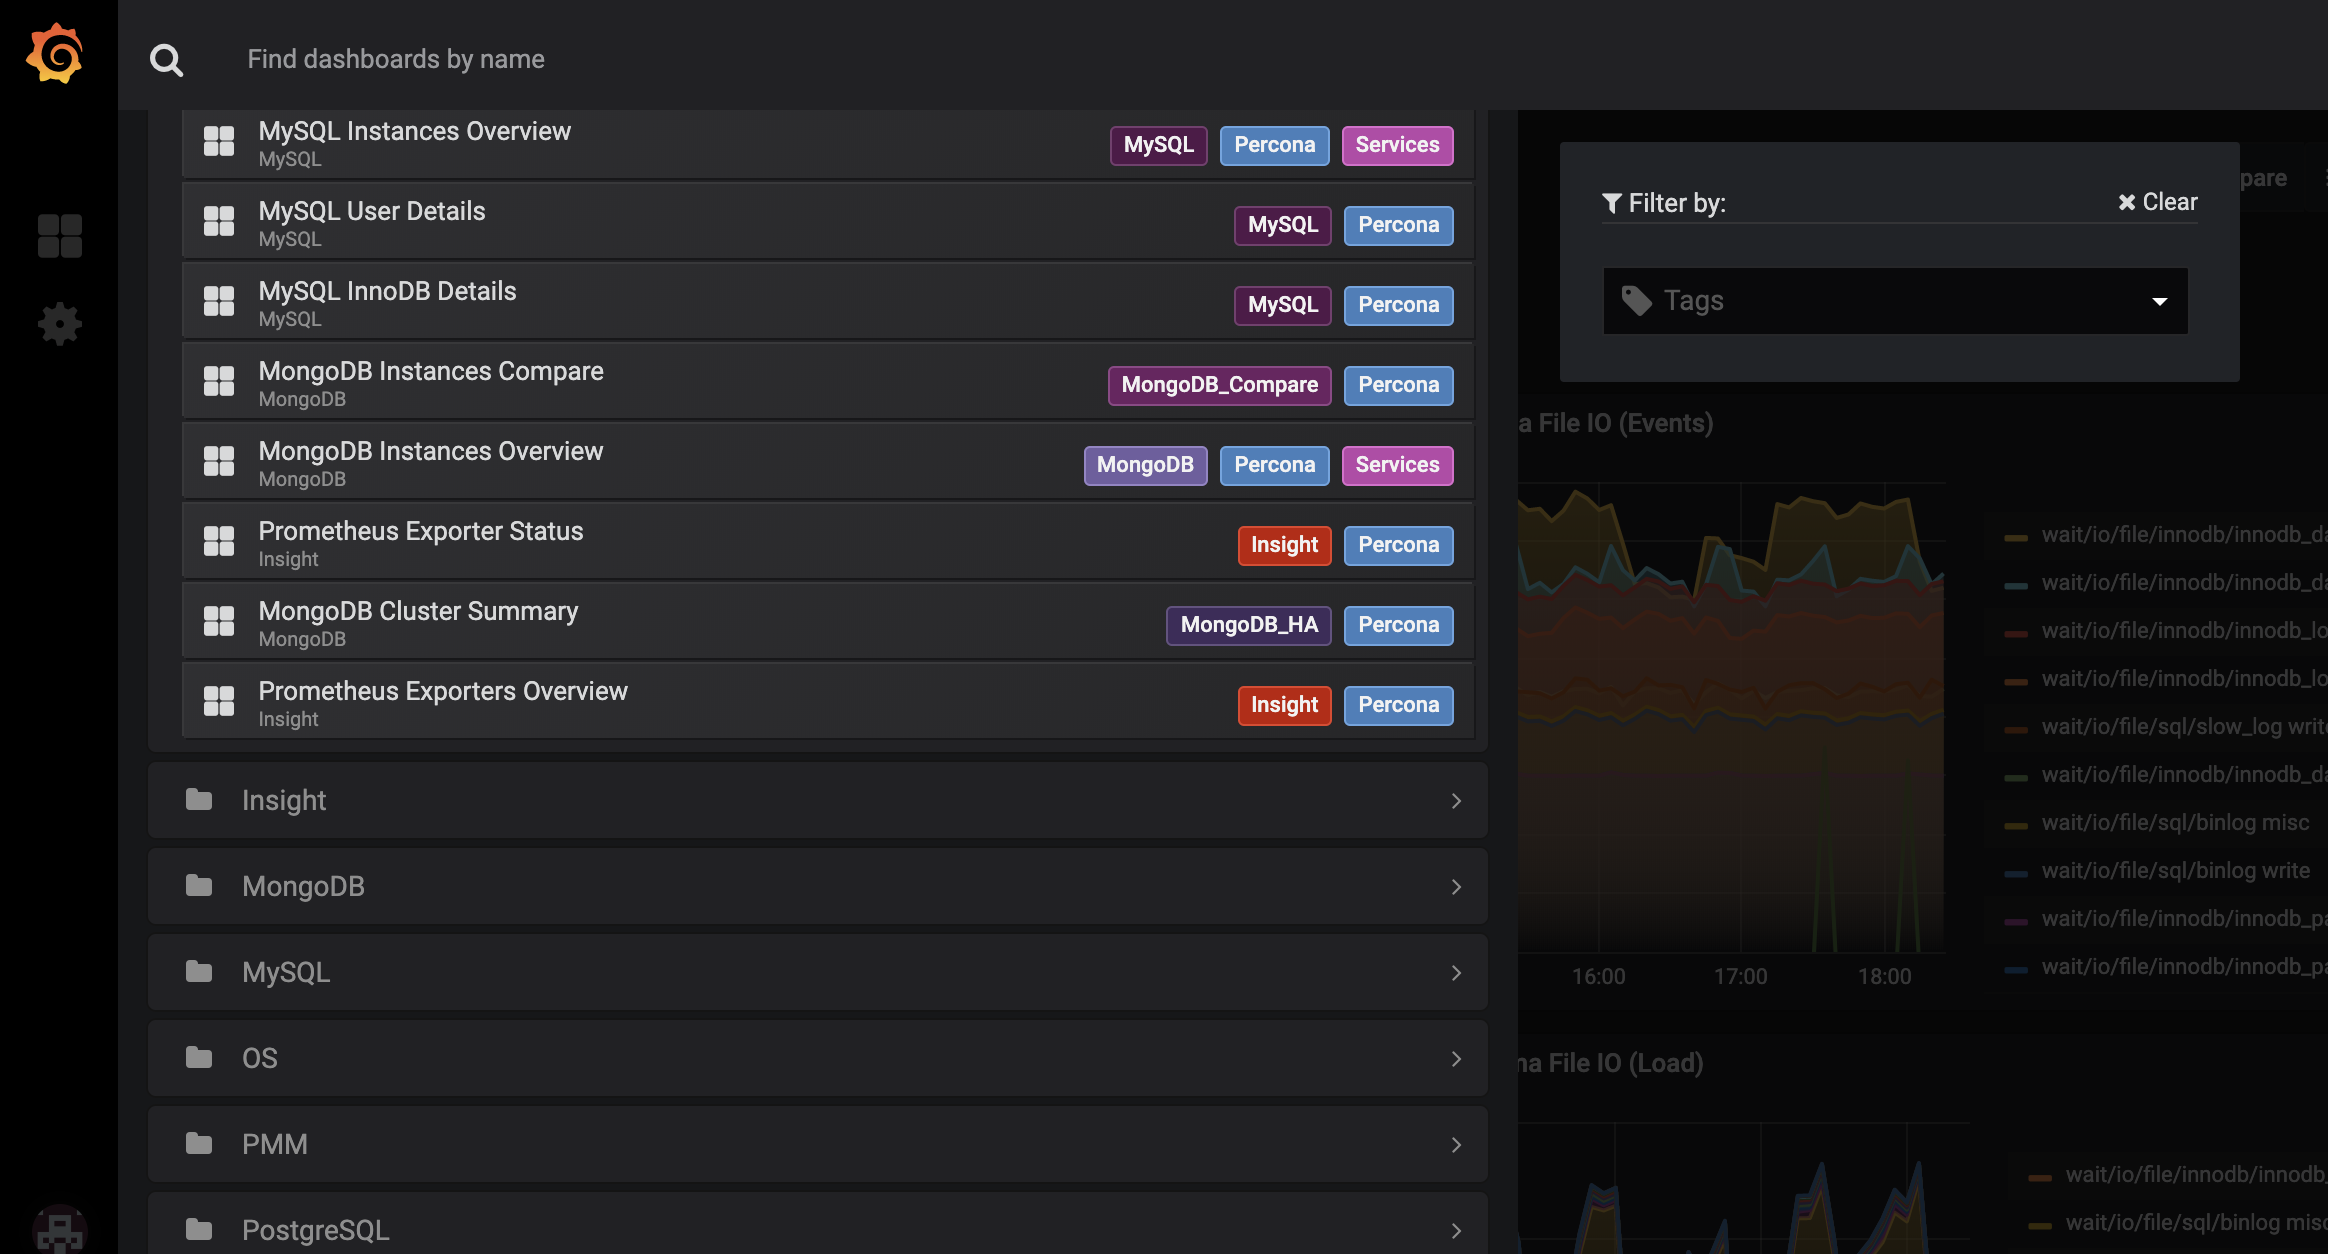
Let’s study the structure of the Dashboard
All Dashboards are located in the “dashboards” folder and each dashboard is a JSON file.
An example can be found here: https://github.com/percona/grafana-dashboards/tree/master/dashboards
Next I have to:
- Find the JSON file I need
- Understand what needs to be changed
- Change it
- Commit and send a Pull Request for review
- Celebrate
It is important that all contributions are carefully reviewed. When I wrote this article, I changed only a few lines, but even this was in review for several days by different expert advisors.
Changing the Dashboard is easy
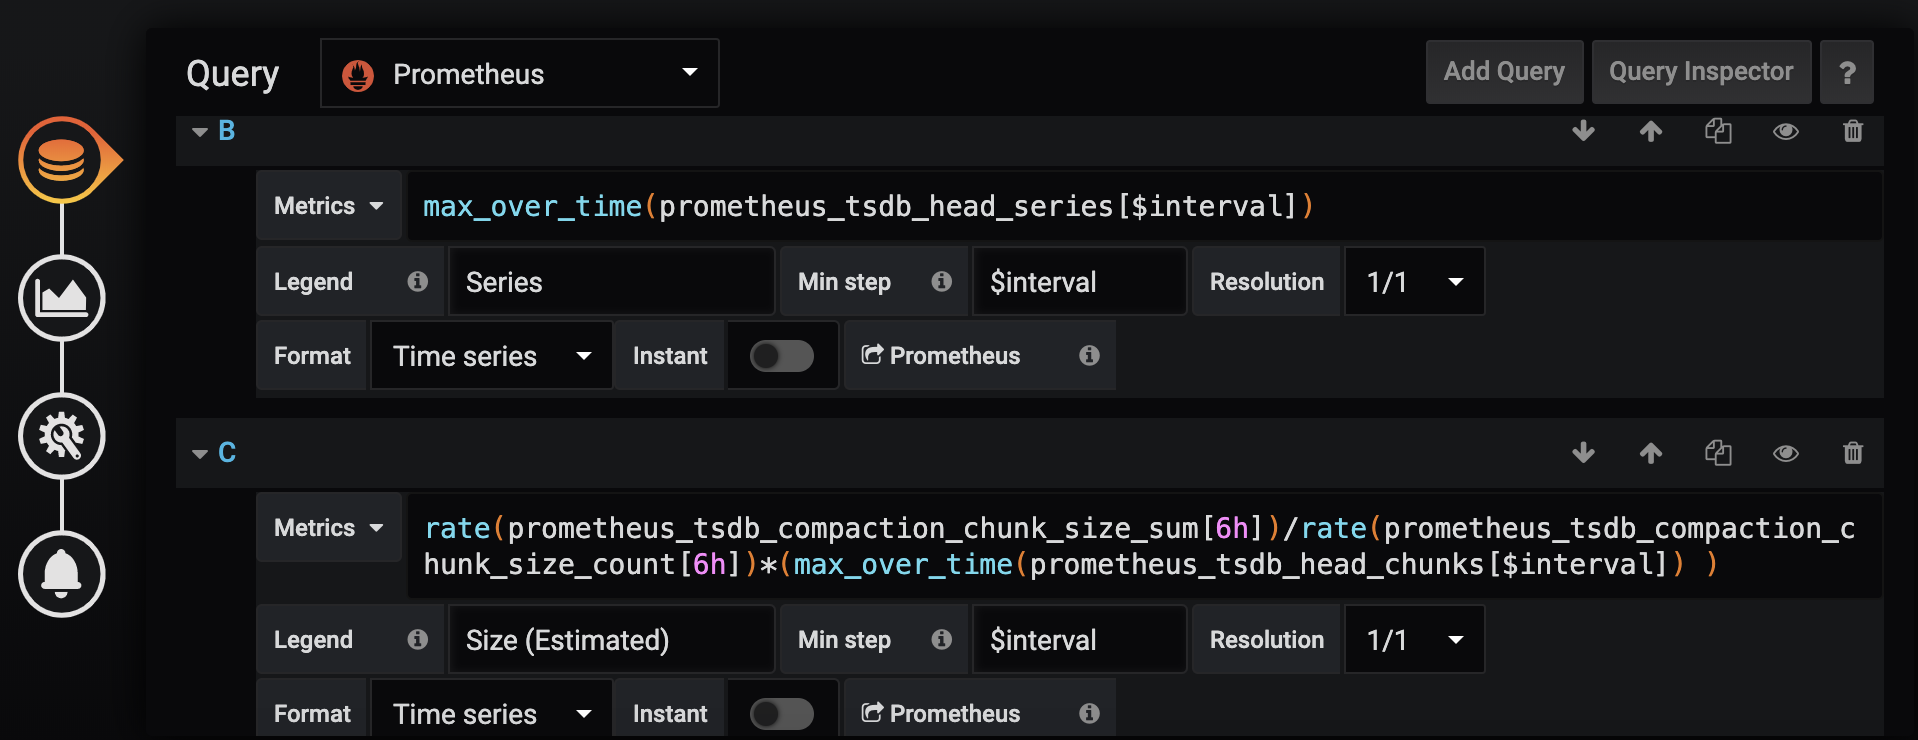
I don’t have to know JSON. You can change Dashboards directly in the PMM interface. All settings are saved in JSON. Each chart has a button “Panel JSON”, which allows you to display JSON code.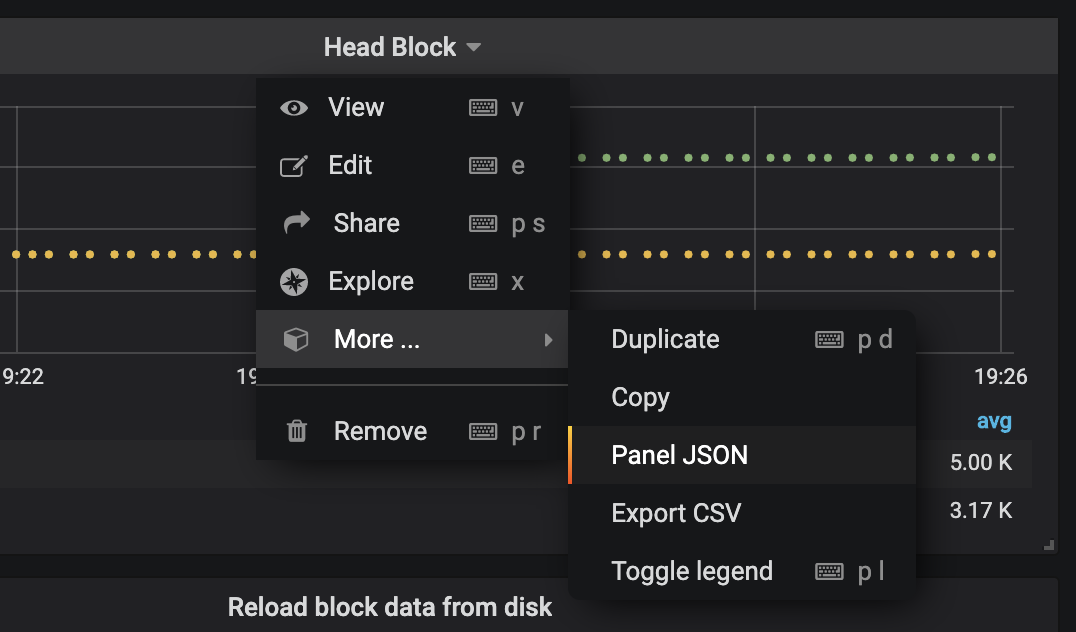
- View the chart settings
- Make the necessary changes
- Save and get the necessary JSON file
If you look at the chart settings, you can understand what functions and arguments they use and check out the documentation:
- https://prometheus.io/docs/prometheus/latest/querying/functions/
- https://prometheus.io/docs/prometheus/latest/querying/operators/
Review the documentation to make the correct description for the chart or make other improvements to the chart.
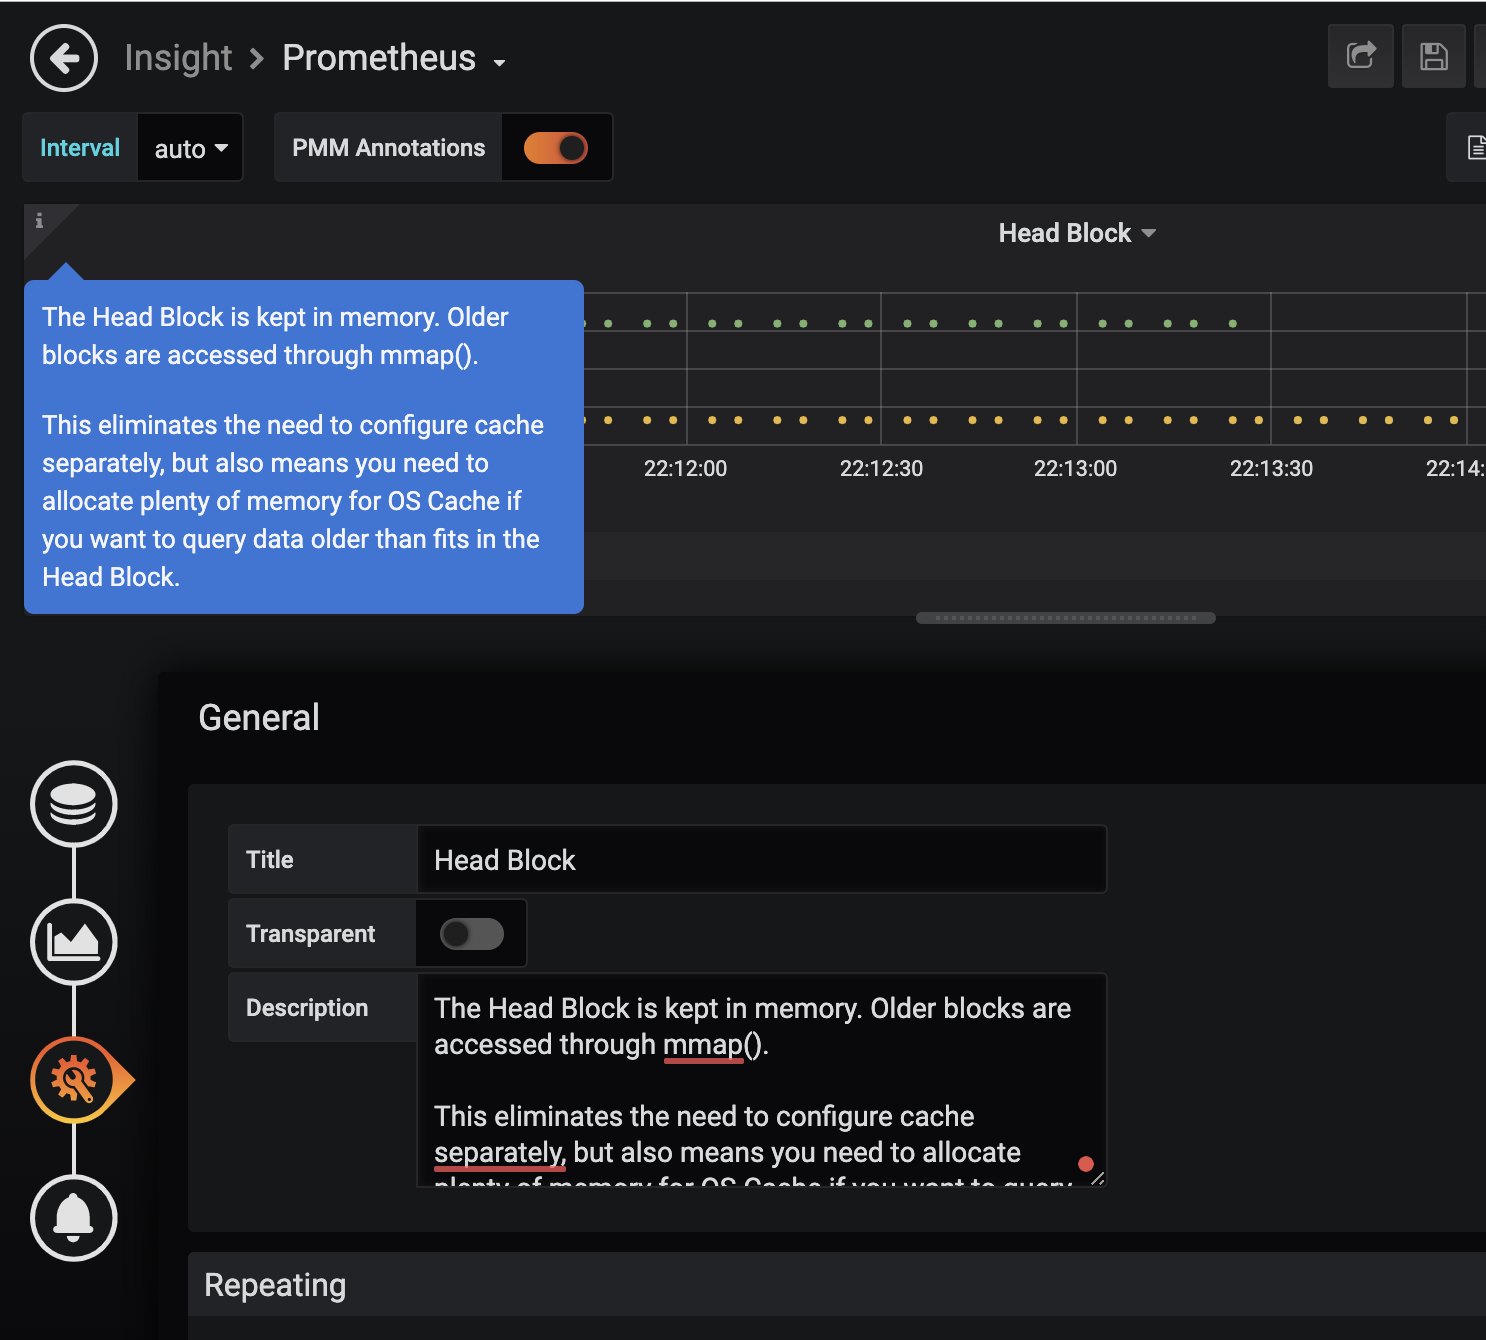
As a next step, I need to add value to the Description field. As soon as I add it, I immediately get the tooltip for the chart.
Save the result
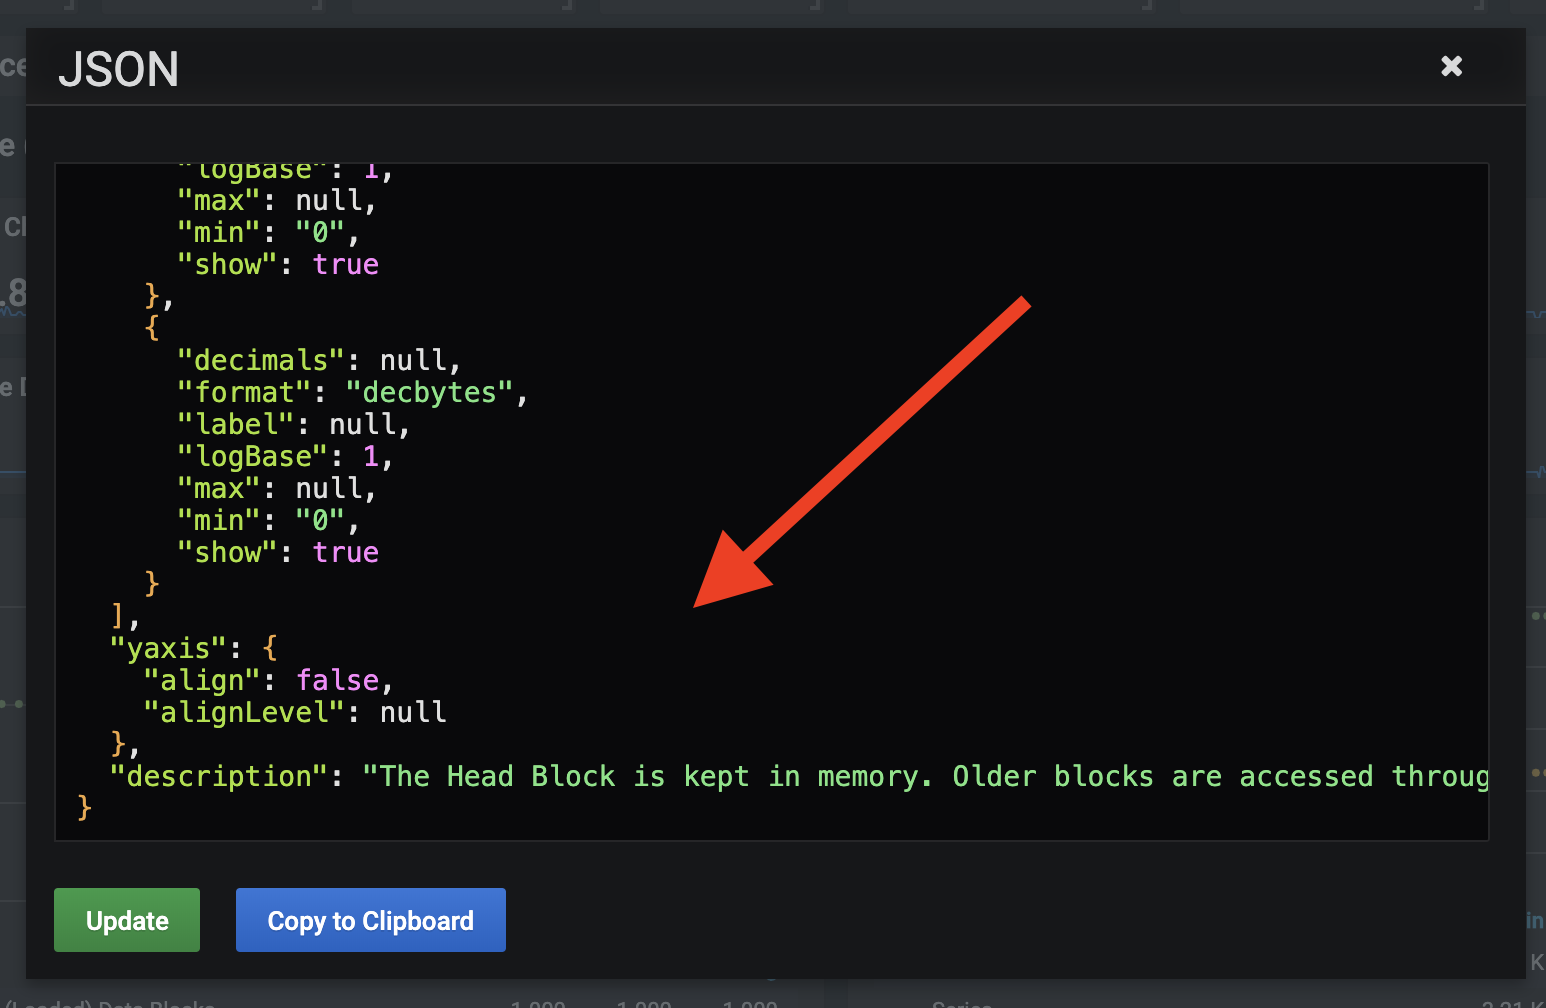
I add the Description and save the chart. Then I open the JSON widget and find my value in the “description” field. It’s simple. I need to move the changes to the git repository.
If I had created a new Dashboard or a chart, it would have been easier for me to transfer the entire file to the repository. But since I only have one line changed, I will only move it.
I made my fork repository’s git clone to a computer beforehand.
- I open the dashboards/Prometheus.json file
- I find the “title” block: “Head Block”
- I add a line with “description” and save the file
Working with the PMM repository
I have already described in detail the work with the repository in the previous article (link), and you can also use the instructions in the repository itself:
https://github.com/percona/grafana-dashboards/blob/master/CONTRIBUTING.md
I created a separate branch, named the commit correctly and sent it to my repository.
I then made a Pull Request to the main grafana-dashboards repository.
I really liked the process of testing the repository. I’ll tell you the steps.
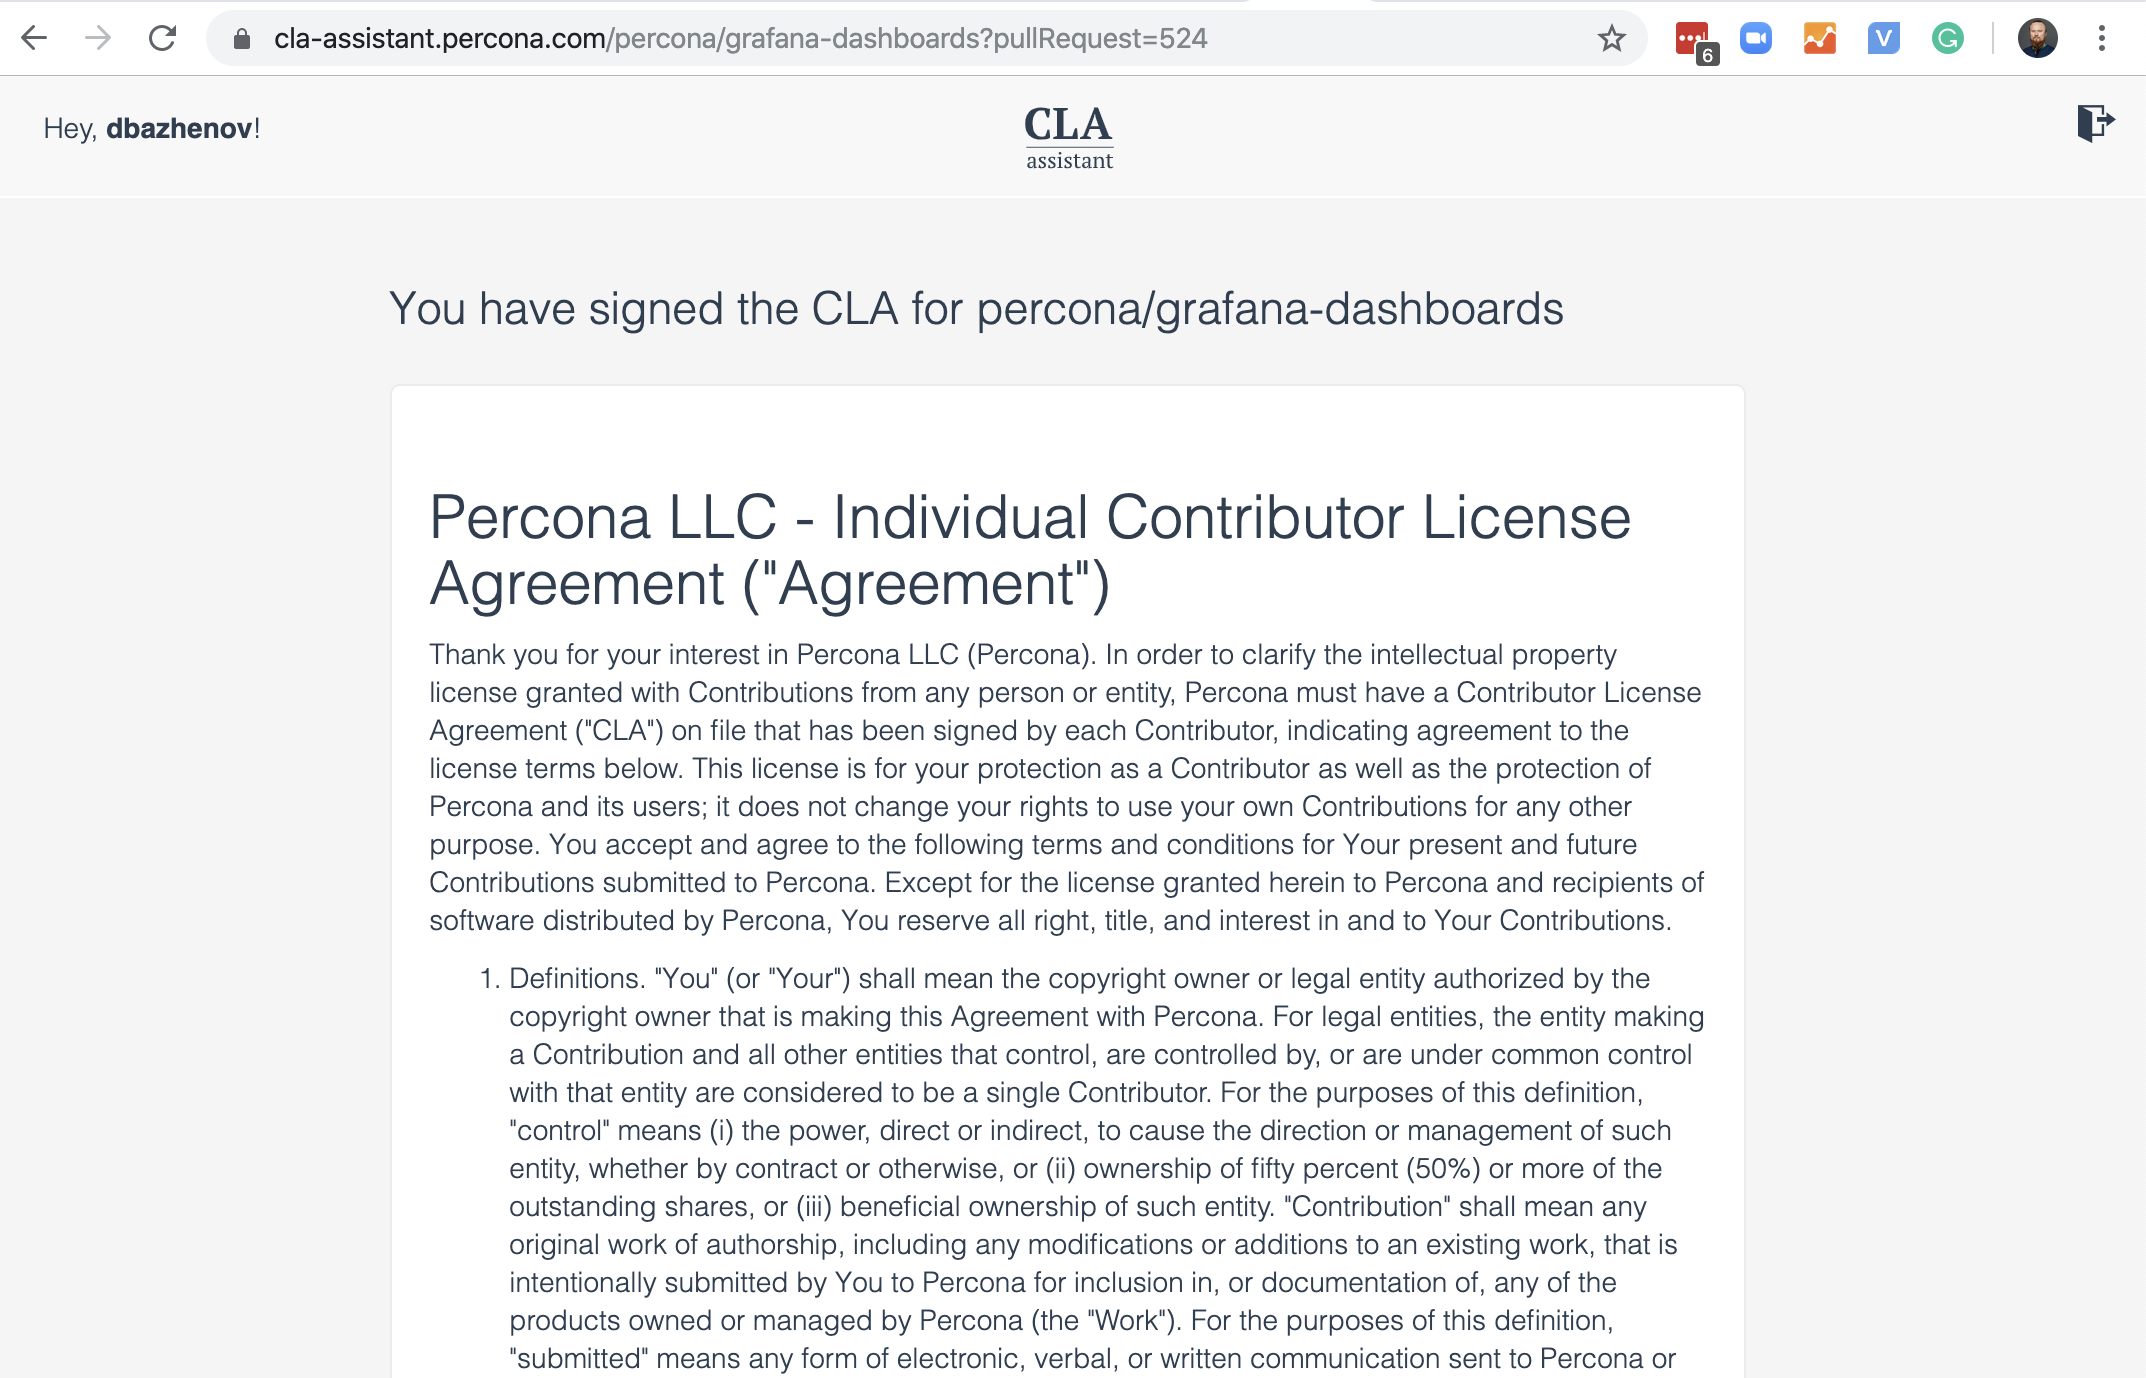
Contributor License Agreement
The first step is to sign the license/cla Contributor License Agreement. This is done with your GitHub account and one button. Simply read and agree.
Automated code review
Your branch will pass an automated code check using the Codecov service.
You will be able to see the process and you will see the result: Codacy/PR Quality Review Up to standards.
A positive pull request.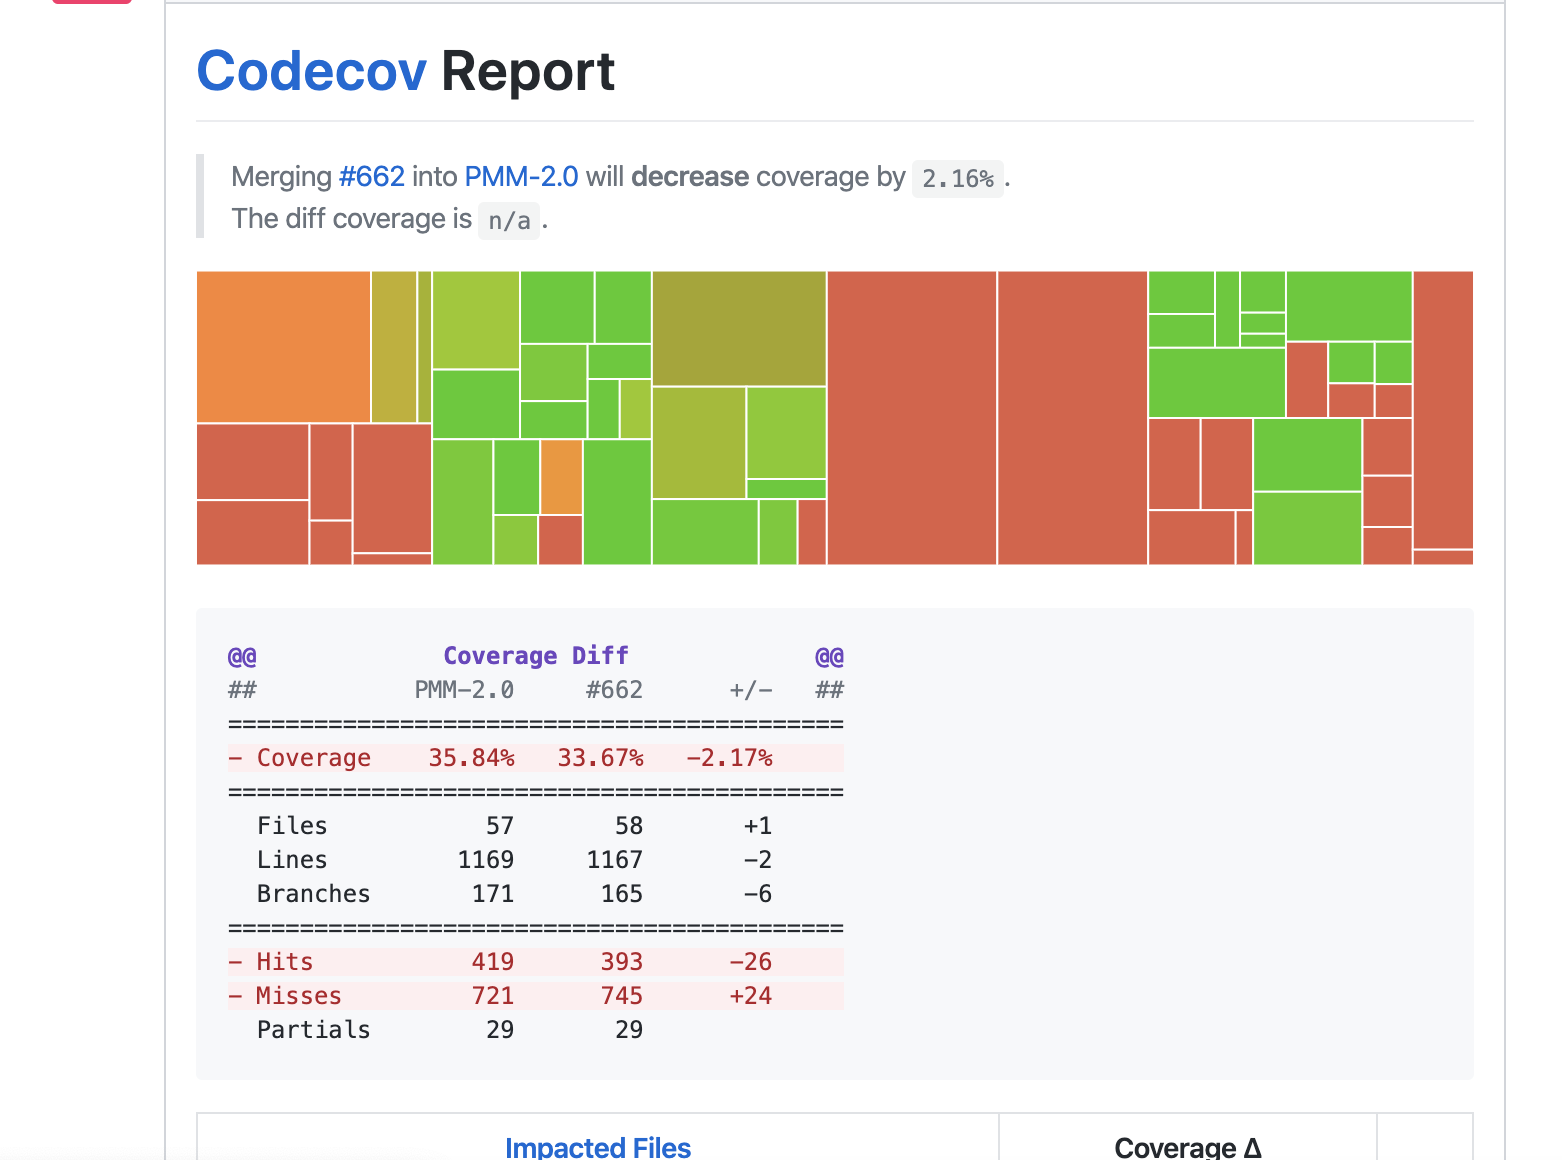
Continuous integration (CI)
After each commit, Jenkins CI will try to build a PMM to:
- Make sure that your changes do not break the PMM
- Run auto testing
It takes a few minutes.
I’m sure you’ll pass all the automatic checks.
You can try to start the build yourself using the instructions in the repository.
If you are interested in these processes, please let me know in the comments.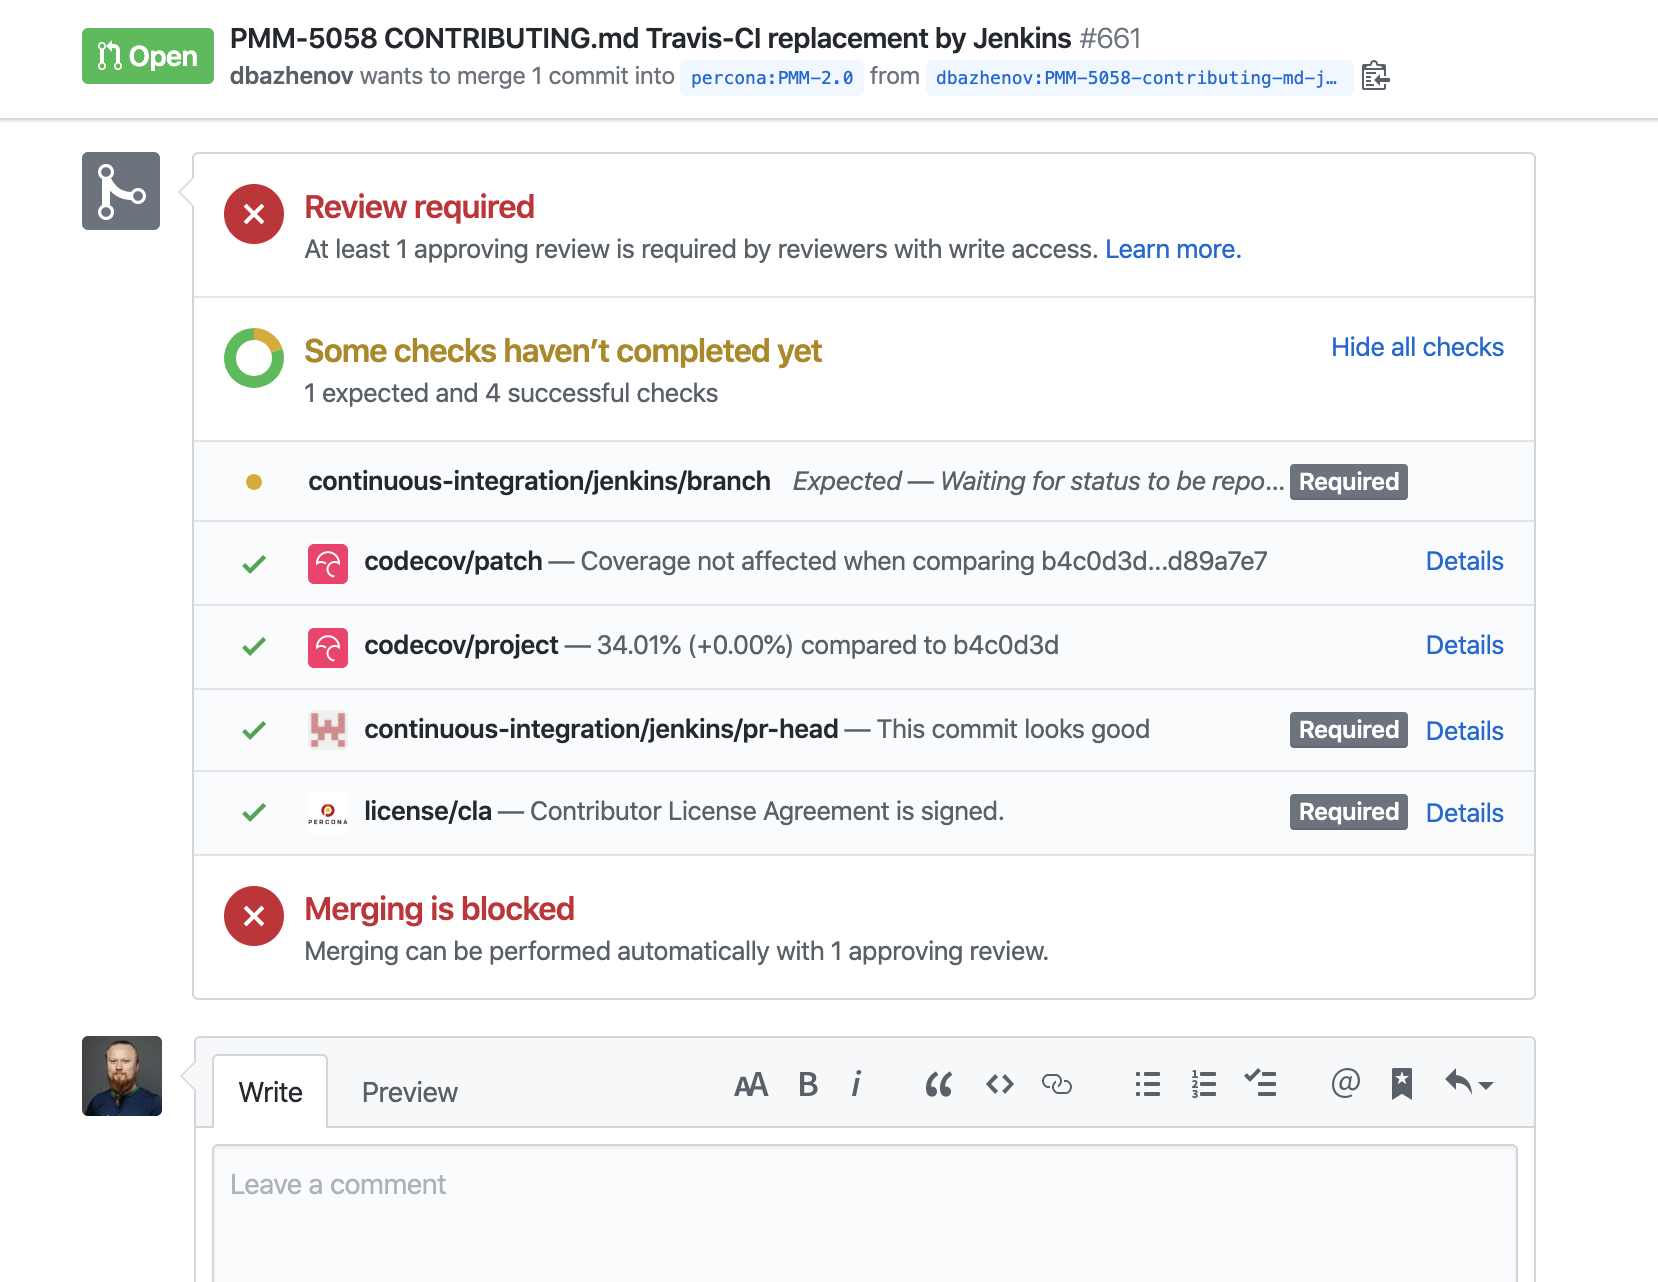
Expert review and code review
Percona experts check all code changes. The more changes, the more experts will be involved.
While I was writing this article, I made several contributions to Dashboards PMM.
- When I changed one line to add a tooltip, my code was reviewed by 2 people: the person responsible for Dashboards and those leaders.
- When I added a 50 line instruction, it already needed to be reviewed by 4 people.
After each task is completed in JIRA, they will be checked by the QA department.
You should not worry about the review process. Percona experts are very friendly, they will write recommendations directly to GitHub. They can even correct some lines at once.
If you have any questions, just text me, I’ll try to help.
I received a few recommendations, made some changes and my contribution was accepted.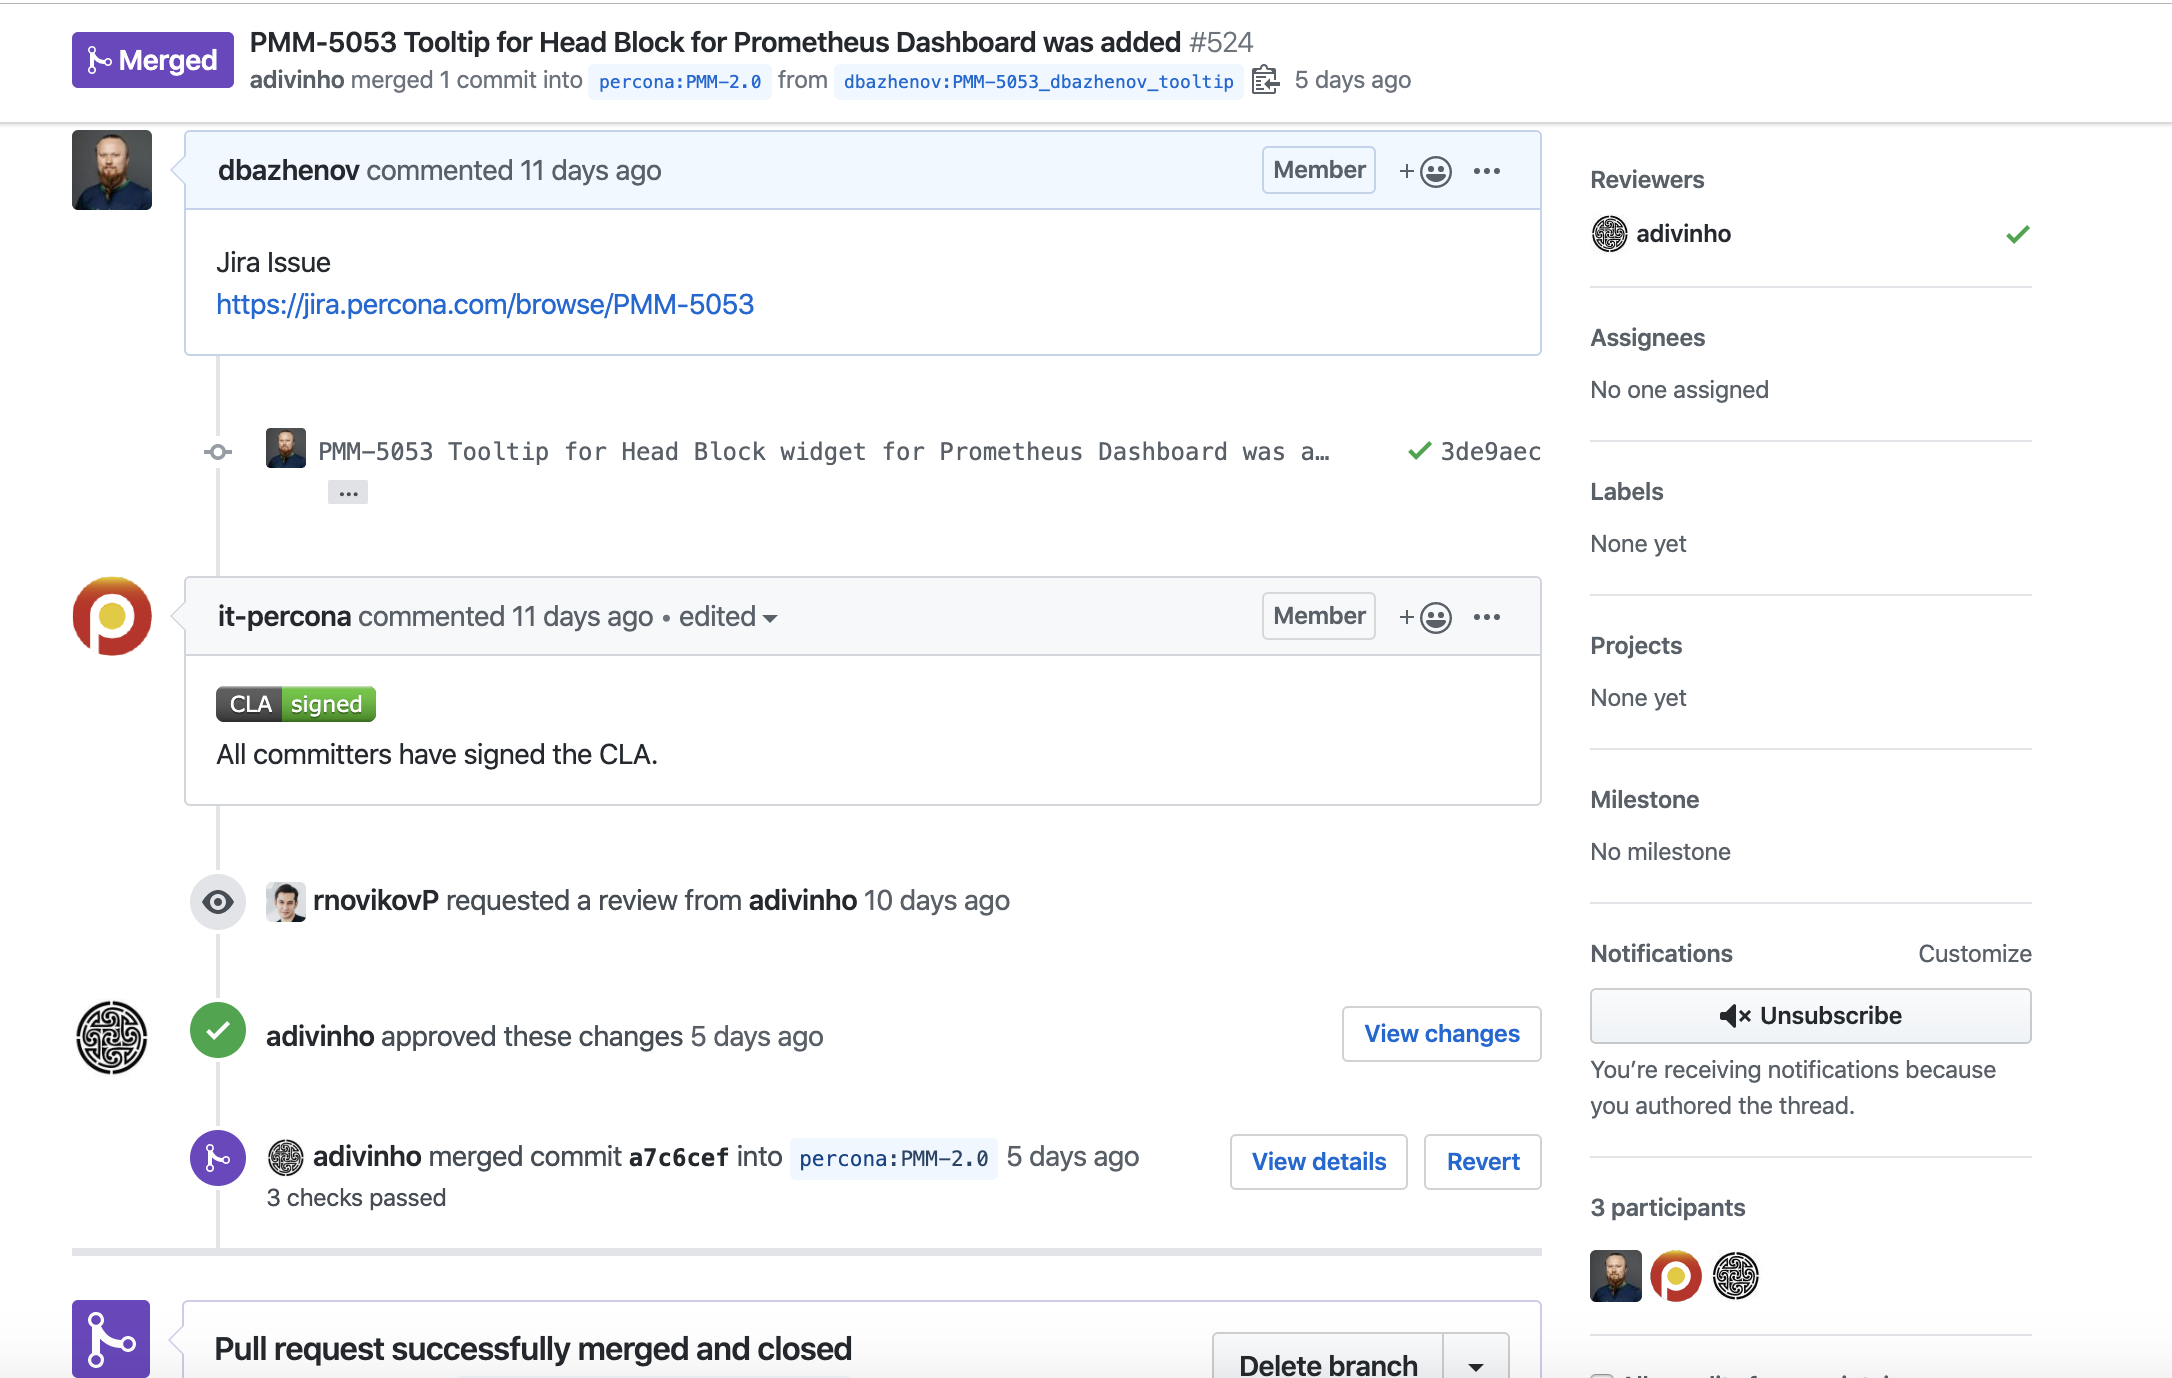
Results
I became a PMM contributor by improving one of the Dashboards. I spent about 30-60 minutes a day and it took me less than a week.
In the process, I was able to add instructions for future contributors (link). You can improve this manual, too.
I urge you to become a contributor. If you need help, just email me.
More ideas for contributions can be found here: Link
My references
Home page of the PMM contributor: https://www.percona.com/community/contributions/pmm
An article on how to become a documentation contributor:
- Instructions for Contributors: Issue at JIRA: https://perconadev.atlassian.net/browse/PMM-5053
- A branch in my repository: https://github.com/dbazhenov/grafana-dashboards/tree/PMM-5053_dbazhenov_tooltip
- Pull Request to PMM repository https://github.com/percona/grafana-dashboards/pull/524
- Confirmed by CLA: https://cla-assistant.percona.com/percona/grafana-dashboards?pullRequest=524

Discussion
We invite you to our forum for discussion. You are welcome to use the widget below.